

Multi-Asset

As kids head back to school, the macro backdrop looks broadly similar the start of the year – AI investment is powering a global investment boom, policy is supportive of loose financial conditions, and inflation in developed markets remains stuck above targets. But as anyone who watched a World Cup match this summer knows, an unchanged score often conceals wild swings in possession, questionable calls, and lots of colorful play-by-play commentary. In the same way, the last eight months have seen notable shifts in market pricing around semiconductors and AI, fiscal policy, and regional asset price dispersion than was inconceivable during the pre-pandemic decade.
As we head into the home stretch of 2026, we discuss three observations that inform current positioning in funds like Tactical Opportunities:
- The supply side continues to be a key determinant of asset prices and the implications of an accelerating supply of soon-to-be issued financial securities across stocks (IPOs), debt (government and corporate bonds), and private markets (securitized 144A debt offerings) could cause additional market indigestion – particularly for bonds – in the coming months.
- Developed market central banks have shifted more hawkish compared to the start of the year, but not enough to offset the year-to-date rise in inflation and growth. Real policy rates that were already accommodative at the start of 2026 remain too loose to bring inflation sustainably back toward central bank targets, which also makes nominal bonds directionally unattractive.
- The opening of the IPO window is coinciding with an acceleration of corporate earnings growth that keeps us positioned long directional equities.
Global investment boom creating bond supply concerns
The One Big Beautiful Bill Act (OBBBA), Iran conflict, tariff refunds, and a winner-take-all corporate approach towards AI investment have unleashed a sharp rise in investment grade debt issuance. The US Treasury’s Quarterly Refunding Announcement (QRA) at the start of August forecast a sustained rise in government debt issuance in the coming quarters, which will be directed toward increased T-Bill issuance. Simultaneously, the corporate sector has been increasing primary market net issuance to finance datacenters and M&A activity. July saw the first signs of supply indigestion with a widening of spreads on hyperscalers, while August had supply concerns shift to government bond markets. The chart below shows the magnitude of the uptick of supply in Q2 and how there will be limited respite for bond buyers into year-end.
Governments and corporates are simultaneously increasing US high grade debt issuance
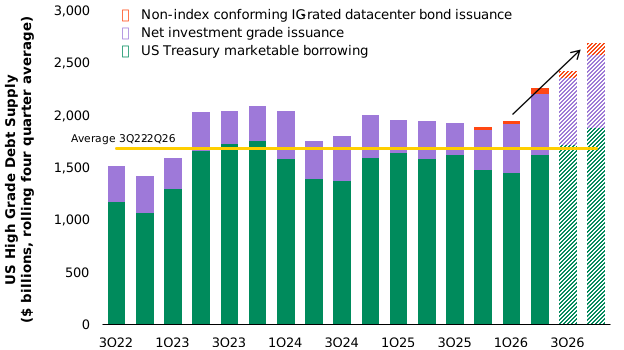
Source: BlackRock, Bloomberg, Barclays Research as of August 5, 2026. Estimates for 3Q26 and 4Q26 use August US Treasury Refunding estimates for US Treasury marketable borrowing; assume net IG issuance continues at the trailing 1yr rate; assume pace of $27b new issuance per quarter for non-index conforming IG-rated data center bonds continues.
Government deficits typically narrow during strong economic expansions, which creates space for corporates to increase investments without raising overall debt supply. However, this is not the case today with procyclical fiscal policy in the US, Europe, and Japan. Massive datacenter investment is thereby creating an additional supply of debt securities that may be “reverse crowding out” government bonds, and the overall supply trajectory remains challenging for debt markets. The investments backed by these bonds are also likely to support robust economic activity and be inflationary on a tactical horizon, so we remain positioned short duration across portfolios.
Central banks maintaining easy financial conditions to support the expansion (and asset prices)
Developed market central bankers began this year with a bias to continue easing policy despite strong global growth, above target inflation, and expansionary fiscal policy. The sharp rise in commodity prices with the closure of the Strait of Hormuz removed the easing bias and policy rates have begun to rise. However, there has been a reluctance across central banks to tighten policy enough to slow the expansion or materially tighten aggregate financial conditions. Low real, front-end policy rates provide liquidity to markets and maintain loose financial conditions.
Policy rates have not tightened much after accounting for the rise in inflation expectations
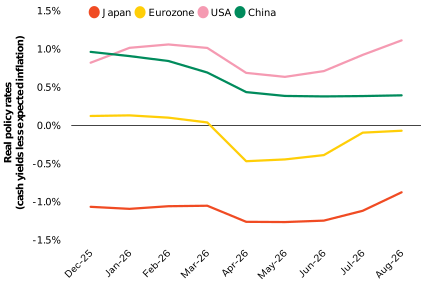
Source: BlackRock with data from Bloomberg and Consensus Economics, as of August 5, 2026.
The chart above shows that hawkish shifts have not yet raised policy rates much compared with the year-to-date rise in inflation expectations. Europe and Japan continue to underwrite negative real policy stances and the US Federal Reserve has been reluctant to hike at all. The high, positive real policy rates in China stand out to us as miscalibrated to their stagnant economy, debt overhang, and imbalanced economic growth model, and in portfolios we hold long Chinese rate positions in the cross-section versus short Europe.
Ample investment opportunities and strong earnings growth bursts open the IPO window
Speculation about a few high-profile IPOs have captivated market attention this year, and the catalysts for rising equity issuance is consistent with rising investment needs and supportive central banks. Companies tend to list publicly when aggregate earnings throughout the economy are robust and relatedly cyclical assets tend to perform well when the IPO window is "open." Intuitively, it makes sense that private companies would choose to go public when investment opportunities abound, financial conditions are loose, and animal spirits are alive – all good descriptions of the prevailing 2026 market backdrop thus far.
The chart below shows US economy-wide earnings growth over the last decade juxtaposed with the quarterly sums of IPO capital raises. Whereas the rise in bond supply discussed earlier in the outlook tends to be a negative for subsequent bond returns, upticks in IPOs tend to coincide with strong earnings growth and be contemporaneously good for stock returns. Given this supportive backdrop along with the strength of the recent earnings results, we maintain directional longs in equities heading into the autumn.
Rising IPO activity coincides with accelerating earnings growth
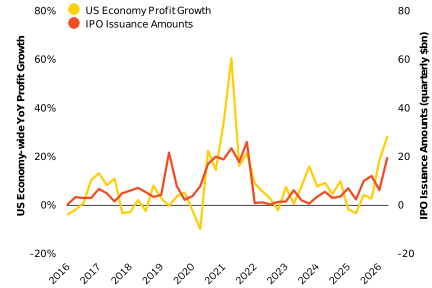
Source: BlackRock with data from the BEA and US Federal Reserve as of August 26, 2026. IPO data are reported in billions of dollars at a monthly rate.
So what does it mean for portfolios?
Across portfolios we are positioned for global reflation – long equities and short duration – on the back of accelerating nominal growth, rising corporate investment intentions, and sticky inflation. We focus our duration shorts in Eurozone bond markets on the back of the ongoing structural shift in fiscal policy along with near-dated upside risks to inflation and issuance in the common currency area. We are long equities in the US and Japan on the back of accelerating earnings growth in both countries against European and emerging market countries with less impressive fundamentals.
In our tactical multi-asset portfolios like the BlackRock Tactical Opportunities Fund, we seek to deliver diversifying returns that are lowly correlated with stock and bond markets. We do so primarily by seeking out relative value opportunities across countries’ stock, bond, and currency markets. In the iShares Global Government Bond USD-Hedged Active ETF (GGOV), we implement our active fixed income views to seek excess return and offer easy access to global diversification.
The Morningstar Rating™ for funds, or “star rating”, is calculated for managed products (including mutual funds, variable annuity and variable life sub-accounts, exchange-traded funds, closed-end funds, and separate accounts) with at least a three-year history. Exchange-traded funds and open-ended mutual funds are considered a single population for comparative purposes. It is calculated based on a Morningstar Risk-Adjusted Return measure that accounts for variation in a managed product’s monthly excess performance, placing more emphasis on downward variations and rewarding consistent performance. The top 10 of products in each product category receive 5 stars, the next 22.5 receive 4 stars, the next 35 receive 3 stars, the next 22.5 receive 2 stars, and the bottom 10 receive 1 star. The Overall Morningstar Rating for a managed product is derived from a weighted average of the performance figures associated with its three-, five-, and 10-year (if applicable) Morningstar Rating metrics. The weights are: 100 three-year rating for 36-59 months of total returns, 60 five-year rating/40 three-year rating for 60-119 months of total returns, and 50 10-year rating/30 five-year rating/20 three-year rating for 120 or more months of total returns. While the 10-year overall star rating formula seems to give the most weight to the 10-year period, the most recent three-year period actually has the greatest impact because it is included in all three rating periods. Past performance does not guarantee future results.
To obtain more information on the funds, including the Morningstar time period ratings and standardized average annual total returns as of the most recent calendar quarter and current month-end, please click on the fund product profile page above.

Tom Becker
Senior portfolio manager, Global Tactical Asset Allocation team
More articles loaded. Use Shift+Tab keys to browse.
Total articles:
Investments
Insights
Retirement
Tools
Resources
About Us


This material is provided for educational purposes only and is not intended to constitute investment advice or an investment recommendation within the meaning of federal, state or local law. You are solely responsible for evaluating and acting upon the education and information contained in this material. BlackRock will not be liable for direct or incidental loss resulting from applying any of the information obtained from these materials or from any other source mentioned. BlackRock does not render any legal, tax or accounting advice and the education and information contained in this material should not be construed as such. Please consult with a qualified professional for these types of advice.
This information should not be relied upon as research, investment advice, or a recommendation regarding any products, strategies, or any security in particular. This material is strictly for illustrative, educational, or informational purposes and is subject to change.
The Tactical Opportunities Fund and GGOV are actively managed and its characteristics will vary.
BlackRock offers investments across a comprehensive range of asset classes and exposures, addressing investor needs with respect to growth, income, and capital preservation.
Bond values fluctuate in price so the value of your investment can go down depending on market conditions.
International investing involves special risks including, but not limited to currency fluctuations, illiquidity and volatility. These risks may be heightened for investments in emerging markets.
Fixed income risks include interest-rate and credit risk. Typically, when interest rates rise, there is a corresponding decline in bond values. Credit risk refers to the possibility that the bond issuer will not be able to make principal and interest payments.
Asset allocation strategies do not assure profit and do not protect against loss.
The funds may use derivatives to hedge its investments or to seek to enhance returns. Derivatives entail risks relating to liquidity, leverage and credit that may reduce returns and increase volatility.
Investing in small- and mid-cap companies may entail greater risk than large-cap companies, due to shorter operating histories, less seasoned management or lower trading volumes.
Please ask your clients to consider the investment objective, risk, charge and expense of the funds carefully before investing. The prospectus and, if available, the summary prospectus contain this and other information about the fund and are available, along with information on other BlackRock funds, by calling 800-882-0052 or at www.blackrock.com. The prospectus and, if available, the summary prospectus should be read carefully before investing.
Prepared by BlackRock Investments, LLC, member FINRA.
©2026 BlackRock, Inc. or its affiliates. All rights reserved. BLACKROCK and iSHARES are trademarks of BlackRock, Inc. or its affiliates. All other trademarks are those of their respective owners.
MASS0926-MH-5889311-EXP0927