
Inside the market

Key Takeaways
- 2025 showed the importance of staying invested in a diversified portfolio: global stocks delivered strong returns despite several pullbacks.
- Bonds returned to being a stabilizer, and Fed rate cuts provided additional tailwinds supporting bond returns over cash.
- Looking to 2026, many of our investors remain constructive on stocks, particularly U.S. and emerging markets, while seeking balance through bonds, alternatives, and option strategies.
2025 Market Recap
Despite elevated uncertainty and shifting geopolitical dynamics, markets proved exceptionally resilient in 2025. Nearly all asset classes posted strong returns, with international equities and gold leading the pack.
Nearly all asset classes had a strong year, particularly international equities and gold
YTD total returns (%)
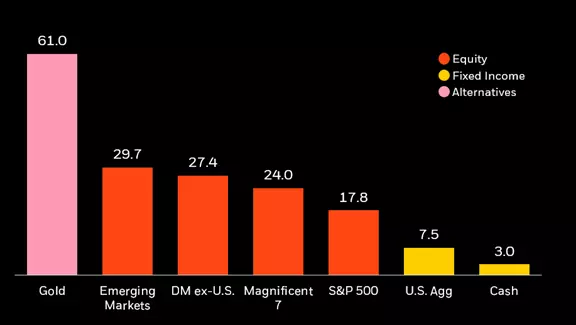
Source: Bloomberg, Morningstar as of 11/28/2025. DM ex-U.S. as represented by MSCI EAFE Index, EM as represented by MSCI Emerging Markets Index, Magnificent 7 as represented by Bloomberg Magnificent 7 Total Return Index, Agg Bond as represented by Agg Bond Index, Cash as represented by the Bloomberg U.S. Treasury Bills 0-3 Month Index, Gold as the Bloomberg Gold Spot. Indexes are unmanaged and one cannot invest directly in an index. Past performance does not guarantee future results.
Investing in AI: A dominant theme of 2025 and central driver for years ahead
AI investment surged again in 2025, and the BlackRock Investment Institute expects another $5-8 trillion in AI-related capex through 2030. As adoption spreads across sectors, the critical thing to watch will be whether the infrastructure ensuring the power grid can support escalating compute demand.
U.S. AI-related stocks had another strong year as companies beat earnings expectations, and we continue to see upside ahead.
Yet many advisors are underweight: across 901 moderate advisor portfolios reviewed, the average technology allocation is 9% below the S&P 500, even though 60% of advisors say they are bullish on AI stocks.1 This gap suggests room for targeted exposure, such as through the iShares A.I. Innovation and Tech Active ETF (BAI).
Earnings – not valuation expansion – drove 2025’s tech rally
Most of 2025’s tech performance came from robust earnings growth, not multiple expansion. In fact, multiples have slightly contracted, and we believe that today’s multiples are justified based on growth expectations.
Tech and U.S growth performance was primarily driven by earnings growth
Decomposition of YTD performance

Source: Bloomberg as of 11/28/25. This analysis provides a decomposition of the drivers of YTD returns: Earnings growth, Valuations/Multiple Expansion (P/E Ratio), and Dividends. Growth as represented by S&P 500 Growth Index; Value as represented by S&P 500 Value Index , Tech as represented by S&P 500 Tech Index, S&P 500 as represented by S&P 500 Index. Index performance is for illustrative purposes only. Index performance does not reflect any management fees or expenses. Indexes are unmanaged and one cannot invest directly in an index. Past performance does not guarantee future results.
Investors seeking exposure to the AI build-out may also look beyond pure tech companies. Utilities and infrastructure firms stand to benefit from rising energy demands. While some opportunities exist in public markets, private capital is likely to play an increasing role, creating opportunity in private credit and private infrastructure strategies.
International stocks delivered their best returns relative to the U.S. since 2006… and could provide valuable diversification
While U.S. mega-cap tech dominated headlines, international stocks quietly delivered standout performance. Emerging markets benefited from their own AI leaders, while developed international markets benefited from a European defense buildout and strong financials performance.
Banks and defense drove developed ex-U.S. stocks higher, while EM benefited from its own AI names
Contribution to YTD return by sector

Source: Bloomberg as of 11/28/25. Developed ex-U.S. as represented by MSCI EAFE Index, emerging markets as represented by MSCI Emerging Markets Index. U.S. as represented by S&P 500 Index. Sector contribution as represented by GICS Sector Classification. Index performance is for illustrative purposes only. Index performance does not reflect any management fees or expenses. Indexes are unmanaged and one cannot invest directly in an index. Past performance does not guarantee future results.
Despite this strength, the average U.S. advisor model portfolio is significantly underweight international equities (21% vs. 35% in the MSCI ACWI).2 Many of our model portfolio teams still prefer U.S. equities overall, but maintain global diversification. We believe those meaningfully underweight may benefit from increasing exposure, given the S&P 500’s moderate correlation — a measurement of how two assets' prices move in relation to each other, expressed as a coefficient from -1 to +1 — to international equities (0.67 vs. the MSCI EAFE and 0.58 vs. the MSCI EM Index).
Reflecting this view, our Target Allocation model portfolio team recently increased its overweight to emerging markets while reducing developed international exposure.
Bonds resumed their role as a diversifier, and outperformed cash
After several years of elevated stock/bond correlations, bonds once again behaved as ballast in 2025, rising during equity pullbacks and benefiting from the Fed resuming rate cuts.
Bonds returned to providing ballast in 2025
Average weekly performance during negative S&P 500 weeks.

Source: Bloomberg, BlackRock. H2 2025 YTD through 11/28/2025. Index performance is for illustrative purposes only. Index performance does not reflect any management fees or expenses. Indexes are unmanaged and one cannot invest directly in an index. Past performance does not guarantee future results.
Despite strong performance across Treasuries, credit, and international bonds, we observe that advisors continue to hold elevated levels of cash and ultra-short fixed income. With the Fed expected to progress further towards a 3% Federal Funds Rate, these allocations may face a more challenging backdrop.
Bonds outperformed cash as the Fed resumed rate cuts
YTD performance (%)

Source: Bloomberg, as of 11/28/25. US Tsy 20+ yr defined as the Bloomberg U.S. Treasury: 20+ Year Total Return Index Value U, Ultrashort as the Bloomberg US Treasury Bills 0-3 Months Unh USD, US Agg as the Bloomberg U.S. Aggregate Index (USD), US Corp HY as the Bloomberg US Corporate High Yield Total Return Index Value Unhedged USD, EM Bonds as the J.P. Morgan EMBI Global Core Index, and DM Ex-US as the World Government Bond Index - Developed Markets Capped Select Index. Index performance is for illustrative purposes only. Index performance does not reflect any management fees or expenses. Indexes are unmanaged and one cannot invest directly in an index. Past performance does not guarantee future results.
Many of our model portfolio teams remain neutral on duration (~6 years) and favor “plus” sectors and flexible bond strategies that can access additional sources of yield. One way to combine these exposures is to use the iShares Systematic Bond ETF (SYSB) for core bond exposure and the iShares Flexible Income Active ETF (BINC) for additional yield.
Alternatives – especially gold – had a great year too
Many alternative assets and strategies also excelled in 2025, often with very low correlation to traditional markets.
Gold was particularly notable, returning ~61% YTD in its strongest year since 1979.3 We also saw the Global Equity Market Neutral Fund (BDMIX) deliver another strong year: BDMIX delivered twice the returns of the Agg Bond Index in 2025, the latest in a string of very strong years.
BlackRock Equity Market Neutral Fund (BDMIX) has maintained a positive return each year since 2022
Annual performance (%)

Source: Bloomberg as of 11/30/25. Stocks refers to the S&P 500, Bonds refers to the Bloomberg Aggregate Bond Index, and BDMIX refers to the BlackRock Global Equity Market Neutral Fund. Performance data represents past performance and does not guarantee future results. Investment return and principal value will fluctuate with market conditions and may be lower or higher when you sell your shares. Current performance may differ from the performance shown. For most recent month-end performance and standardized performance, click here.
Despite their benefits, diversifying alternatives are still underrepresented in advisor portfolios: only 18% of the 23,937 advisor model portfolios we’ve analyzed over the last year include an allocation to alternatives. And even those that do tend to hold relatively small positions: The average moderate portfolio has an 8% allocation to alternatives, while the Target Allocation Hybrid with Alternatives 60/40 model portfolio has an 18% allocation.4
Investment opportunities for 2026
Many of our investors are entering 2026 with a constructive equity outlook, but with a diversified approach to asset allocation.
We maintain a bias towards the big AI names, which can be accessed via the iShares A.I. Innovation and Tech Active ETF (BAI), and we also like the iShares U.S. Equity Factor Rotation Active ETF (DYNF) for a nimble approach to quick-moving markets.
While we’re encouraged to see bonds acting as ballast again, and see potential opportunities in strategies such as the iShares Systematic Bond ETF (SYSB) and iShares Flexible Income Active ETF (BINC), we also see potential benefits to incorporating diversifying alternatives such as the BlackRock Equity Market Neutral Fund (BDMIX).
Last, with cash rates projected to fall further, we anticipate many investors seeking additional income. Options-based strategies such as the iShares U.S. Large Cap Premium Income Active ETF (BALI) and iShares 20+ Year Treasury Bond BuyWrite Strategy (TLTW) may be able to provide rate pick-ups versus traditional assets, as can the custom SMA overlays offered by SpiderRock Advisors.
BlackRock is here to help. Connect with your BlackRock market team or call 877-ASK-1BLK if you have any questions on translating markets into the right portfolio implications for you.
Explore the Advisor Outlook – BlackRock’s monthly market outlook for financial advisors – for more details on our latest market and portfolio insights.
Emily Fredrix Goodman and Oliver Hering contributed to this piece.
To obtain more information on the fund(s) including the Morningstar time period ratings and standardized average annual total returns as of the most recent calendar quarter and current month end, please click on the fund tile. The Morningstar Rating for funds, or "star rating", is calculated for managed products (including mutual funds, variable annuity and variable life subaccounts, exchange-traded funds, closed-end funds, and separate accounts) with at least a three-year history. Exchange-traded funds and open-ended mutual funds are considered a single population for comparative purposes. It is calculated based on a Morningstar Risk-Adjusted Return measure (excluding any applicable sales charges) that accounts for variation in a managed product's monthly excess performance, placing more emphasis on downward variations and rewarding consistent performance. The top 10% of products in each product category receive 5 stars, the next 22.5% receive 4 stars, the next 35% receive 3 stars, the next 22.5% receive 2 stars, and the bottom 10% receive 1 star. The Overall Morningstar Rating for a managed product is derived from a weighted average of the performance figures associated with its three-, five-, and 10-year 60-119 months of total returns, and 50% 10-year rating/30% five-year rating/20% three-year rating for 120 or more months of total returns. While the 10-year overall star rating formula seems to give the most weight to the 10-year period, the most recent three-year period actually has the greatest impact because it is included in all three rating periods.
The performance quoted represents past performance and does not guarantee future results. Investment returns and principal values may fluctuate so that an investor’s shares, when redeemed, may be worth more or less than their original cost. Current performance may be lower or higher than the performance data quoted. All returns assume reinvestment of all dividend and capital gain distributions. Refer to www.blackrock.com or www.ishares.com to obtain performance data current to the most recent month-end.
Read our latest articles
Investments
Insights
Retirement
Tools
Resources
About Us

1 BlackRock webinar on 11/4/25, share of 453 unique respondents shown in response to the question “What is your outlook for AI-related stocks?”
2 BlackRock, Morningstar as of 10/31/25. This analysis includes 5,010 unique model portfolios containing equities collected by BlackRock in the 3 months ending 10/31/25.
3 Bloomberg as of 11/30/2025. Gold as the Bloomberg Gold Spot Price.
4 Morningstar, BlackRock, Aladdin. “Average FA” data is as of 10/31/2025. “BLK model” allocations as of 11/18/25. For illustrative purposes only. Advisor models collected by BlackRock are grouped into 5 risk cohorts for analysis, based on total equity allocation. Models in the “moderate” risk cohort are defined as any portfolio with an overall equity allocation of between 50-65%. BlackRock’s risk model data is supplemented by asset allocation and fund characteristic data from Morningstar. The portfolios analyzed represent a subset of the industry, and not its entirety. As such, there may be certain biases present in the data that reflect the advisors who choose to work with BlackRock to analyze their portfolios.
Carefully consider the Funds' investment objectives, risk factors, and charges and expenses before investing. This and other information can be found in the Fund’s prospectuses or, if available, the summary prospectuses, which may be obtained by visiting the iShares Fund and BlackRock Fund prospectus pages. Read the prospectus carefully before investing.
Investing involves risks, including possible loss of principal.
Actively managed funds do not seek to replicate the performance of a specified index, may have higher portfolio turnover, and may charge higher fees than index funds due to increased trading and research expenses. There is no guarantee that an active fund will meet its investment objective. There is no guarantee that dividends will be paid
AI technology relies on large data sets, which can lead to inaccuracies. Companies in AI face competition, rapid obsolescence, and depend on demand from various industries. Regulatory scrutiny could limit AI development, with data collection facing closer examination and potential fines. Country-specific regulations could also impact AI and big data companies.
Funds that concentrate investments in specific industries, sectors, markets or asset classes may underperform or be more volatile than other industries, sectors, markets or asset classes and than the general securities market. Diversification and asset allocation may not protect against market risk or loss of principal.
There can be no assurance that performance will be enhanced or risk will be reduced for funds that seek to provide exposure to certain quantitative investment characteristics ("factors"). Exposure to such investment factors may detract from performance in some market environments, perhaps for extended periods. In such circumstances, a fund may seek to maintain exposure to the targeted investment factors and not adjust to target different factors, which could result in losses.
There is no guarantee that the classification system used to determine the rotation model or strategy will achieve its intended results. The fund may engage in active and frequent trading of its portfolio securities which may result in higher transaction costs to the fund.
Alternative investments present the opportunity for significant losses and some alternative investments have experienced periods of extreme volatility. Alternative investments may be less liquid than investments in traditional securities.
Index returns are for illustrative purposes only. Index performance returns do not reflect any management fees, transaction costs or expenses. Indexes are unmanaged and one cannot invest directly in an index. Past performance does not guarantee future results.
Fixed income risks include interest-rate and credit risk. Typically, when interest rates rise, there is a corresponding decline in the value of debt securities. Credit risk refers to the possibility that the debt issuer will not be able to make principal and interest payments.
When the Fund sells call options on a large cap equity index, it receives a premium but it takes on the risk that these options may reduce any profit from increases in the market value of the long equity positions held by the Fund. Any such reduction in profits would be the difference between the payoff of the call option and the premium received. The Fund would also retain the risk of loss if the long equity positions decline in value. The premiums received from the options may not be sufficient to offset any losses sustained from the long equity positions. Factors that may influence the value of the options generally include the underlying asset’s price, interest rates, dividends, the actual and implied volatility levels of the underlying asset’s price, and the remaining time until the options expire, among others. The value of the options written by the Fund typically do not increase or decrease at the same rate as the underlying asset’s price on a day-to-day basis due to these factors.
A BuyWrite Strategy ETF’s use of options may reduce returns or increase volatility. During periods of very low or negative interest rates, the Underlying Fund may be unable to maintain positive returns. Very low or negative interest rates may magnify interest rate risk. In a falling interest rate environment, the ETF may underperform the Underlying Fund. By writing covered call options in return for the receipt of premiums, the ETF will give up the opportunity to benefit from increases in the value of the Underlying Fund but will continue to bear the risk of declines in the value of the Underlying Fund. The premiums received from the options may not be sufficient to offset any losses sustained from the volatility of the Underlying Fund over time. The ETF will be subject to capital gain taxes, ordinary income tax and other tax considerations due to its writing covered call options strategy.
This material is not intended to be relied upon as a forecast, research or investment advice, and is not a recommendation, offer or solicitation to buy or sell any securities or to adopt any investment strategy. The opinions expressed are as of the date indicated and may change as subsequent conditions vary. The information and opinions contained in this material are derived from proprietary and non-proprietary sources deemed by BlackRock to be reliable, are not necessarily all-inclusive and are not guaranteed as to accuracy. As such, no warranty of accuracy or reliability is given and no responsibility arising in any other way for errors and omissions (including responsibility to any person by reason of negligence) is accepted by BlackRock, its officers, employees or agents. This material may contain “forward-looking” information that is not purely historical in nature. Such information may include, among other things, projections and forecasts. There is no guarantee that any of these views will come to pass. Reliance upon information in this material is at the sole discretion of the viewer.
This material contains general information only and does not take into account an individual's financial circumstances. This information should not be relied upon as a primary basis for an investment decision. Rather, an assessment should be made as to whether the information is appropriate in individual circumstances and consideration should be given to talking to a financial professional before making an investment decision.
Prepared by BlackRock Investments, LLC, member FINRA.
©2026 BlackRock, Inc. or its affiliates. All Rights Reserved. BLACKROCK and iSHARES are trademarks of BlackRock, Inc. or its affiliates. All other trademarks are those of their respective owners.
GPS0226-5133637-EXP0227
iCRMH1225U/S-5039934