

Fixed Income

The good news is real. The easy trade is not. Growth has held up, artificial intelligence investment is showing up in earnings and capital spending, and fixed income is offering yields that create serious cushion for portfolios. But leadership is narrow, the consumer is more uneven than the headline data suggest, and the overnight rate is pressing hardest on the parts of the economy that are already lagging.
That mix makes these next few months in markets more demanding. The last phase rewarded investors for owning the AI growth theme and letting beta do much of the work. The next phase can still reward exposure here, but the bar is higher. That is what we mean by getting serious, not moving to the sidelines, but moving from broad exposure to deliberate construction. Portfolios need to know what they own, why they own it, and what could cause it to reprice.
AI investment in 2026: real growth, narrow engine
Nominal gross domestic product (GDP) has grown at an average rate of 5.7% annually over the trailing three years, 40% higher than the 2010s average. Since the end of 2024, nonresidential investment, only about 14% of GDP, has accounted for 48% of real GDP growth. That is the center of the current cycle.
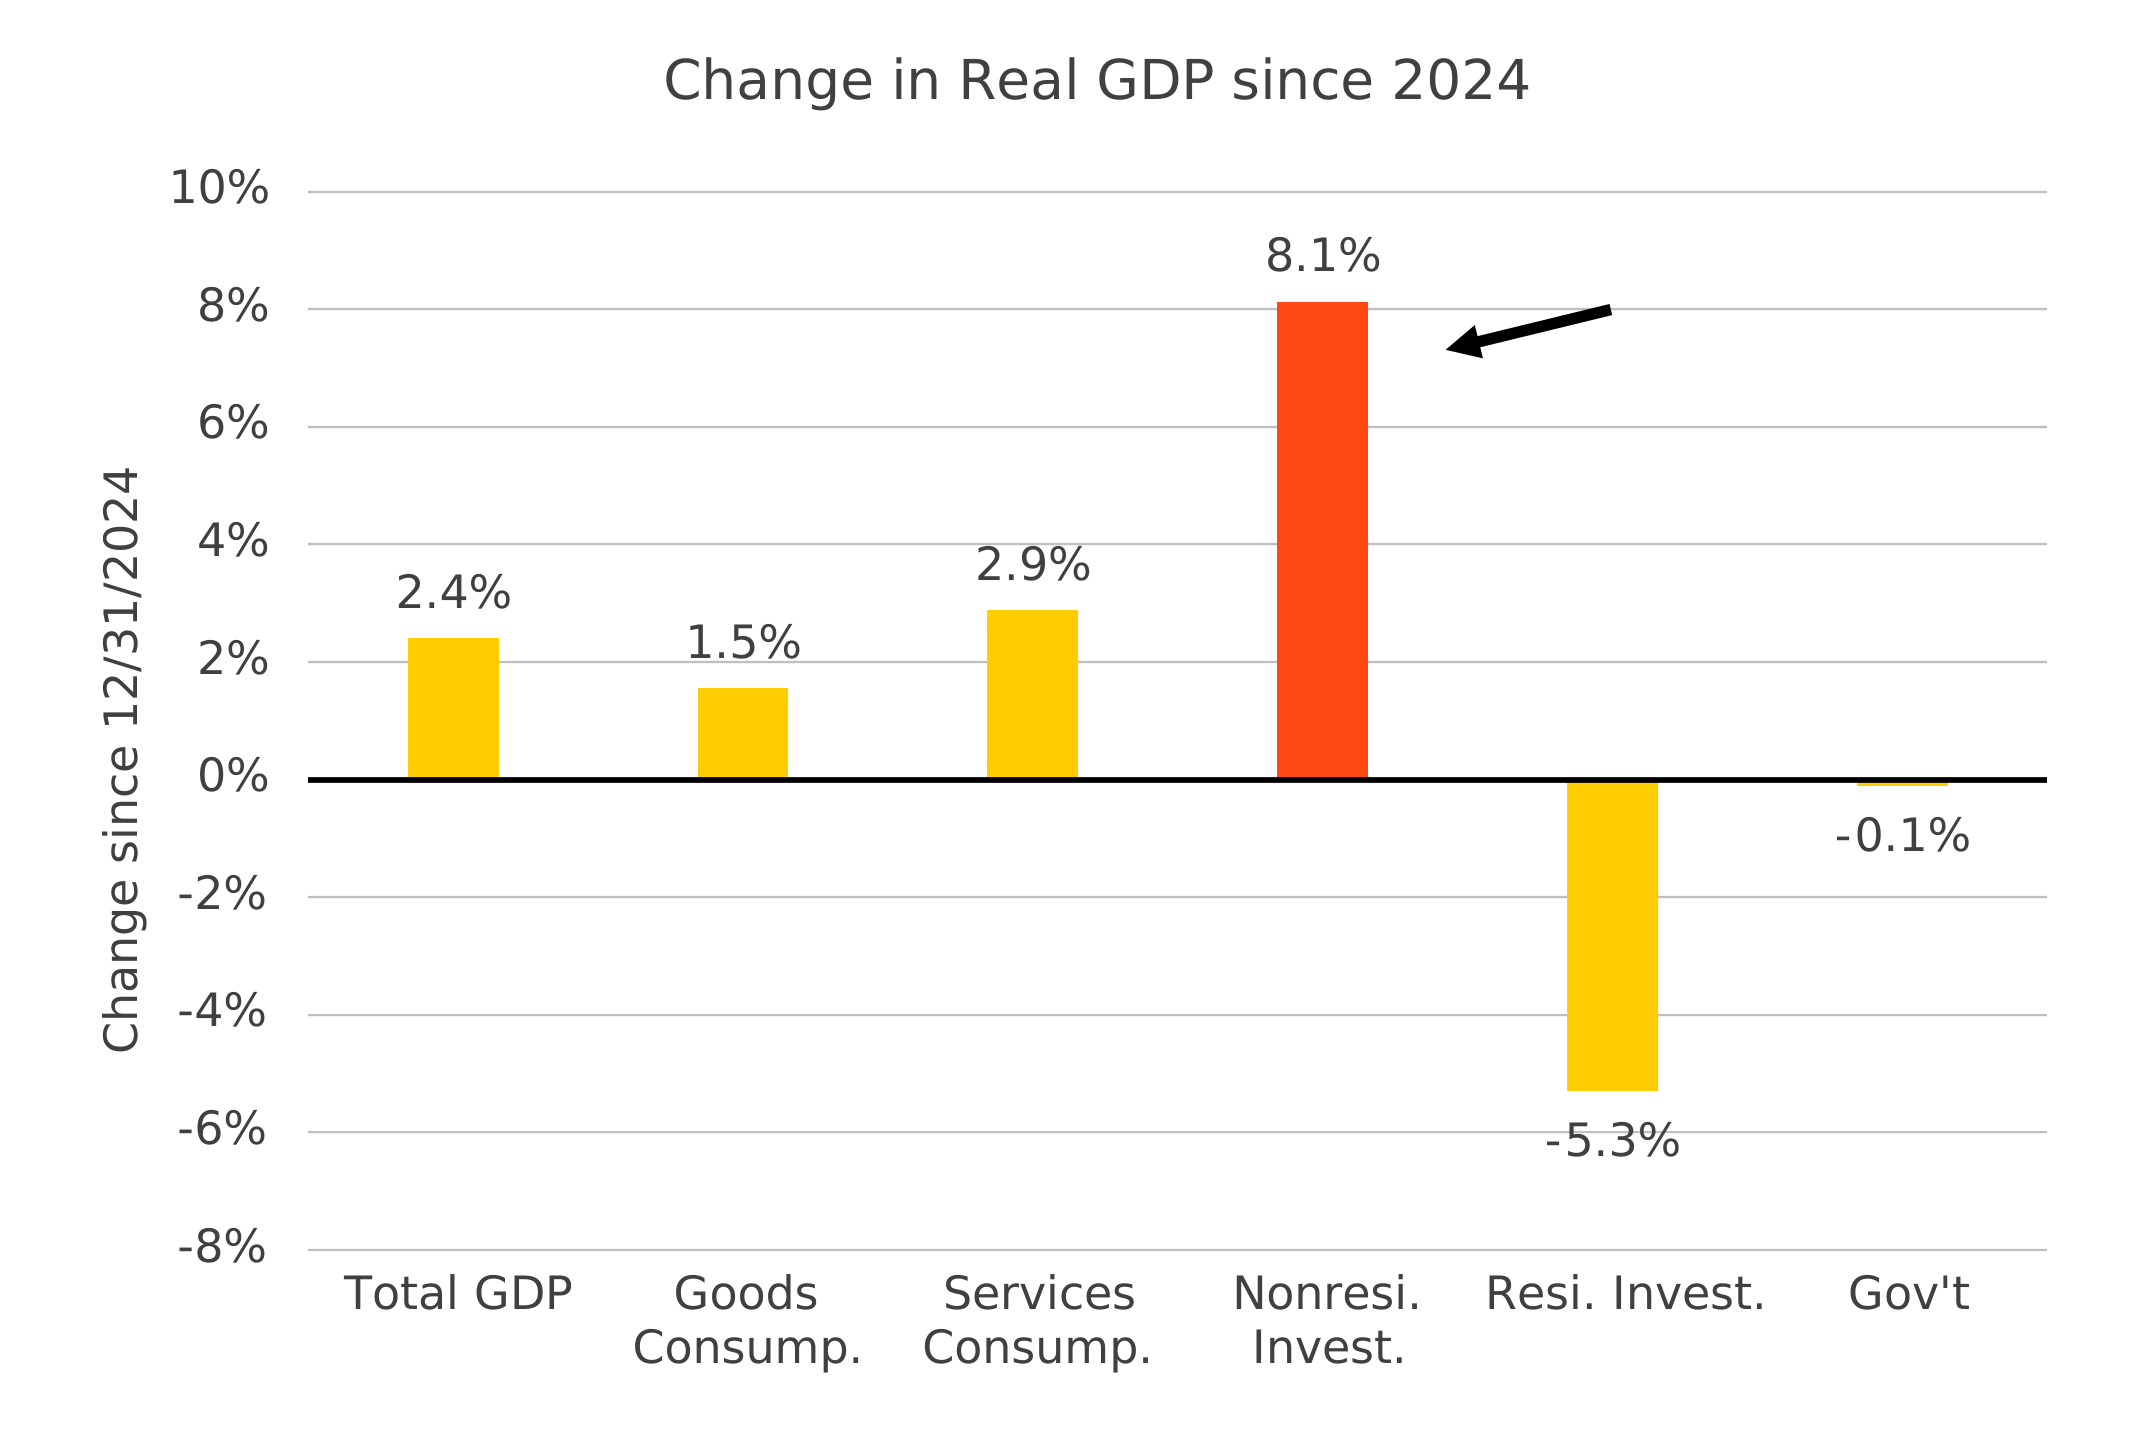
Bureau of Economic Analysis, as of 3/30/2026
Hyperscaler capital expenditures have grown more than 80% year over year, reaching an estimated $715 billion in 2026, while chip revenues have risen to an estimated $570 billion. Semiconductor forward earnings have continued to climb through multiple shocks. This is the first place where we push back on the growing bubble narrative: bubbles do not usually come with this much forward earnings growth.
But real does not mean broad. A basket of 32 AI-related companies contributed 12.0% to year-to-date S&P 500 returns, while the rest of the index contributed negative 2.3%.1 That concentration is not inherently bad. Equity markets have always been driven by a small number of exceptional companies. The issue is that capex and earnings growth are unlikely to continue in a straight line up forever. Investment can remain high while the rate of change slows, and markets tend to price that shift before the data confirms it. Getting serious about AI means respecting both truths: the investment cycle is real, and the easiest part of owning it has likely already happened.
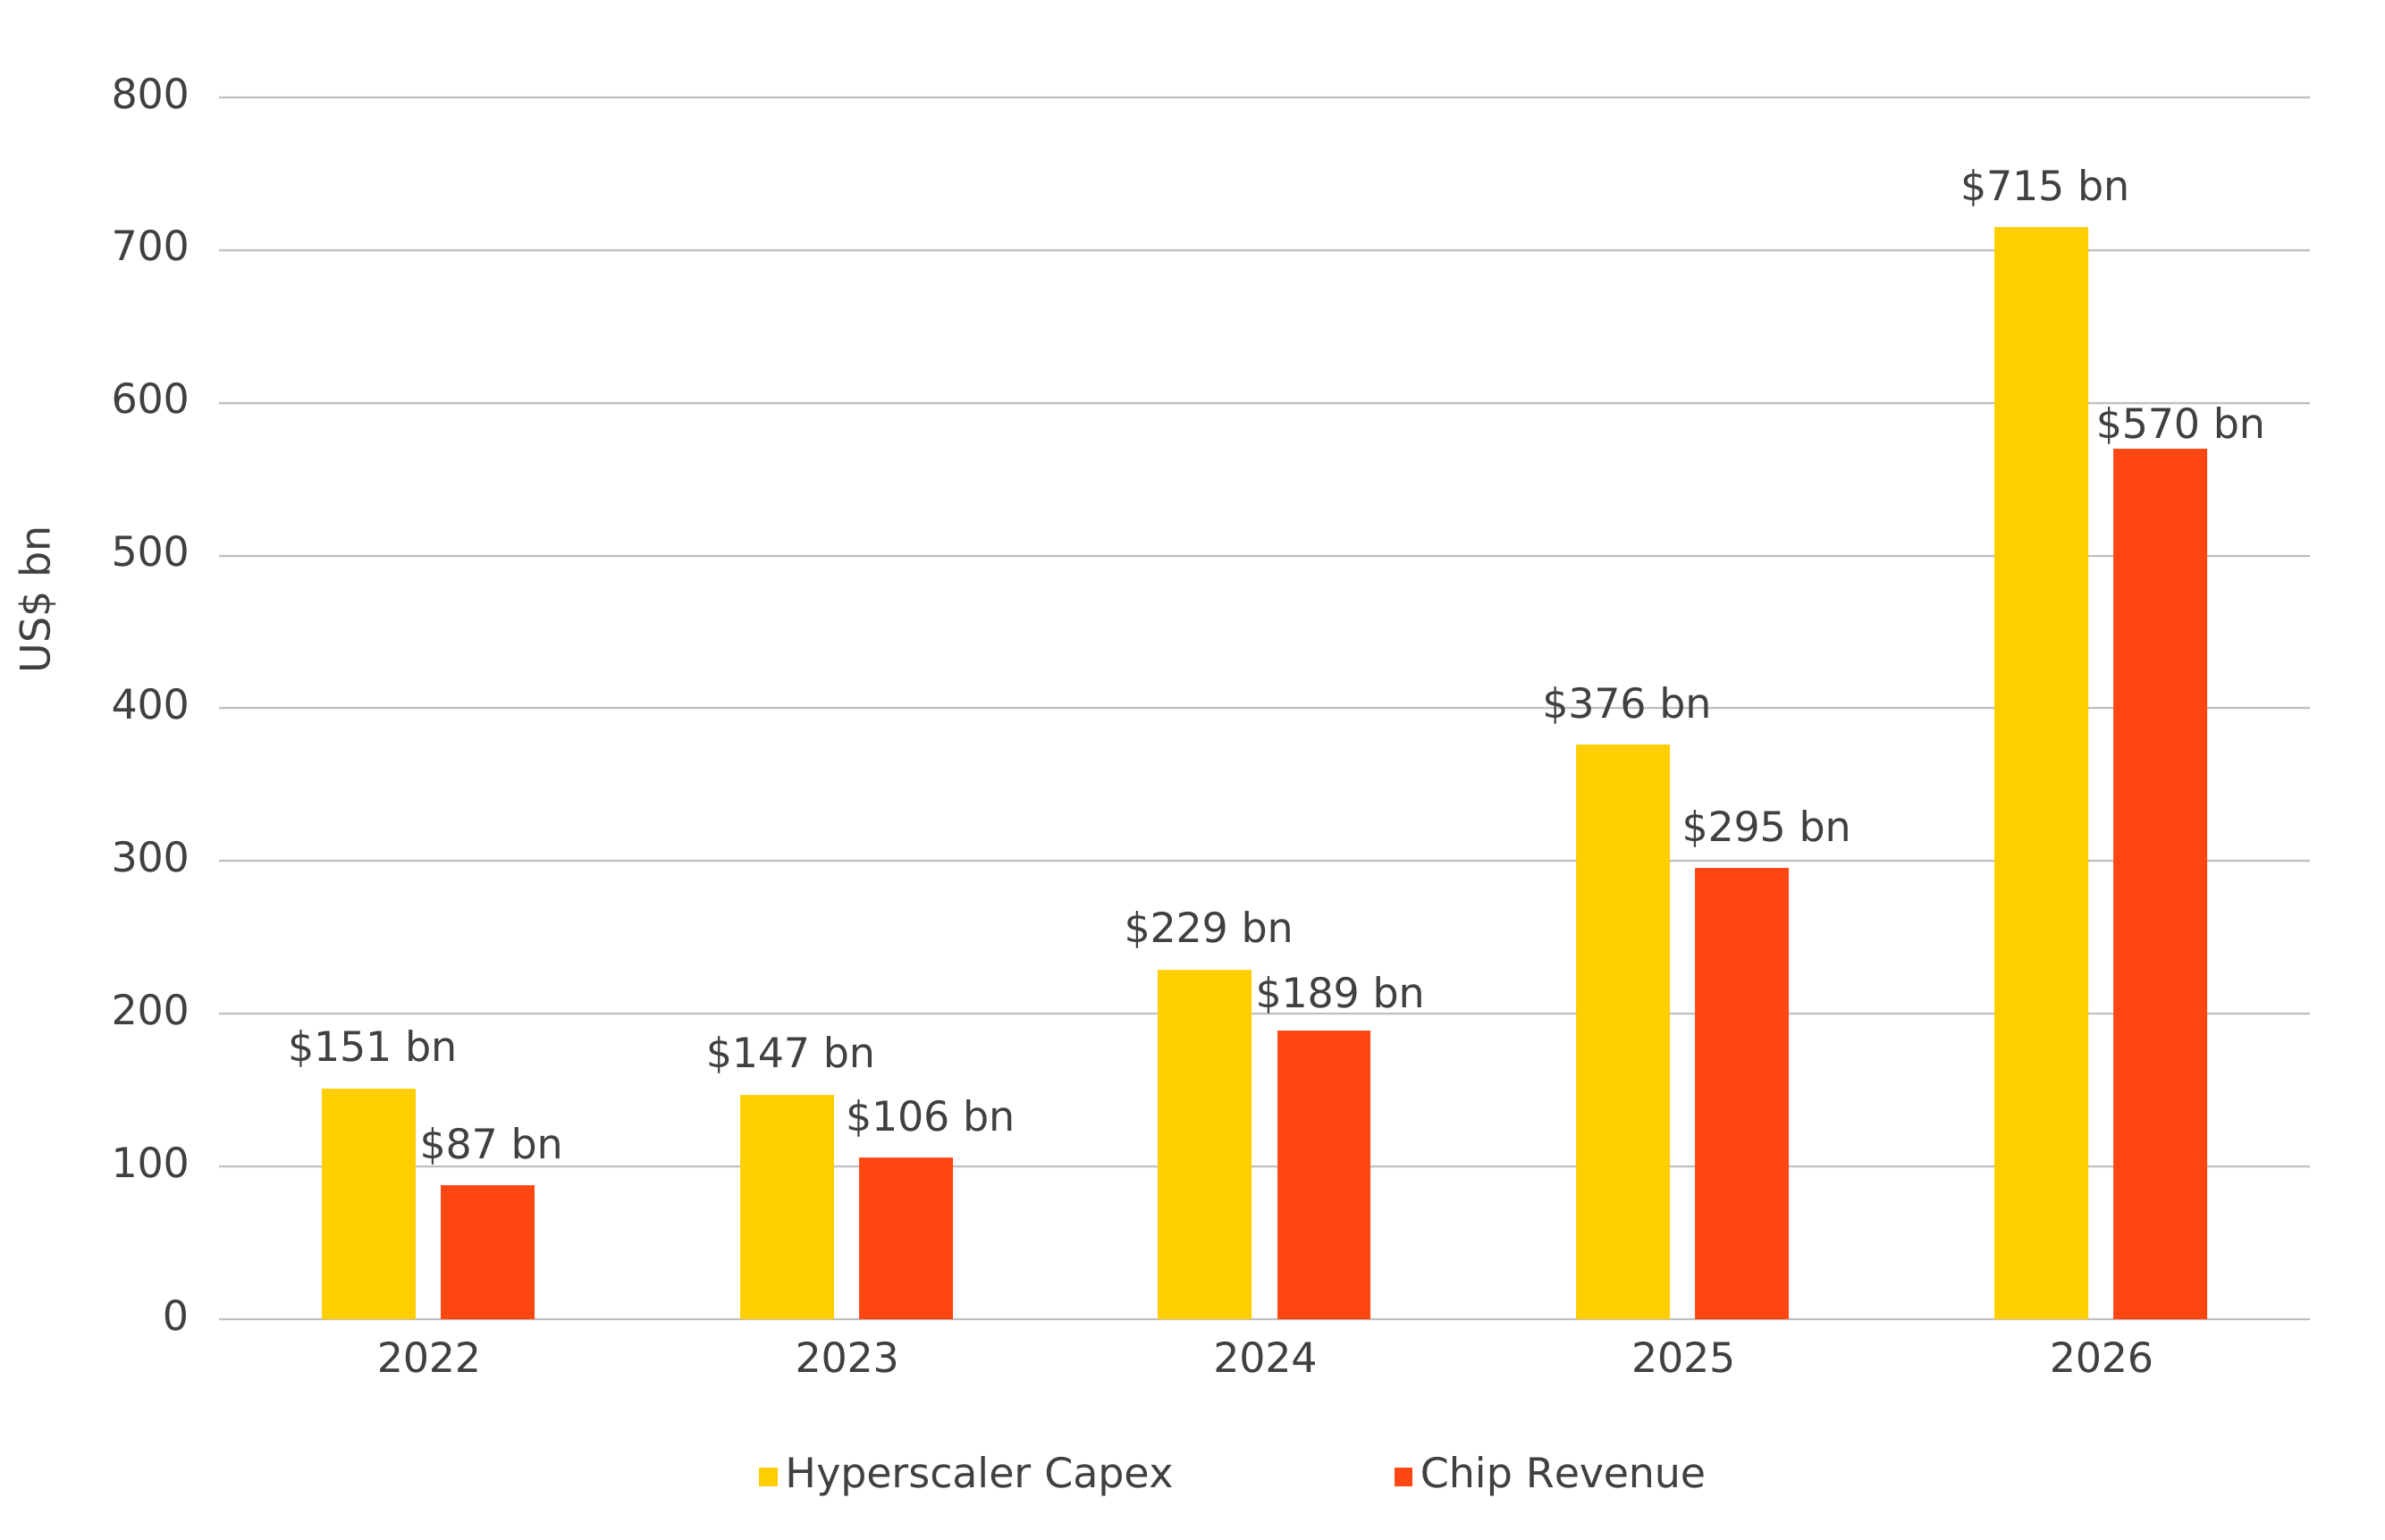
Bloomberg, as of 6/12/2026
AI financing and equity supply: the next phase has to be absorbed
The first leg of the AI buildout was funded by hyperscaler balance sheets, private markets, and the cash flow of the strongest companies in the world. The next leg is broader. OpenAI and Anthropic are scaling multi-year compute commitments across hyperscalers and infrastructure providers. Those commitments do not disappear with an IPO. They become funding needs across equity, debt, structured products, and private markets.
This is how the opportunity set is changing shape. Hyperscalers can still fund a large share of the AI buildout, but more of their cash flow is being recycled into capex instead of buybacks, dividends, or balance-sheet flexibility. At the same time, more of the funding burden is moving into public markets through IPOs, expiring lockups, debt issuance, and equity raises from already-public companies. That broadens the investable universe, but it also creates supply that markets must absorb. The same AI story that created the winners is now creating the financing needs that could test demand from here.
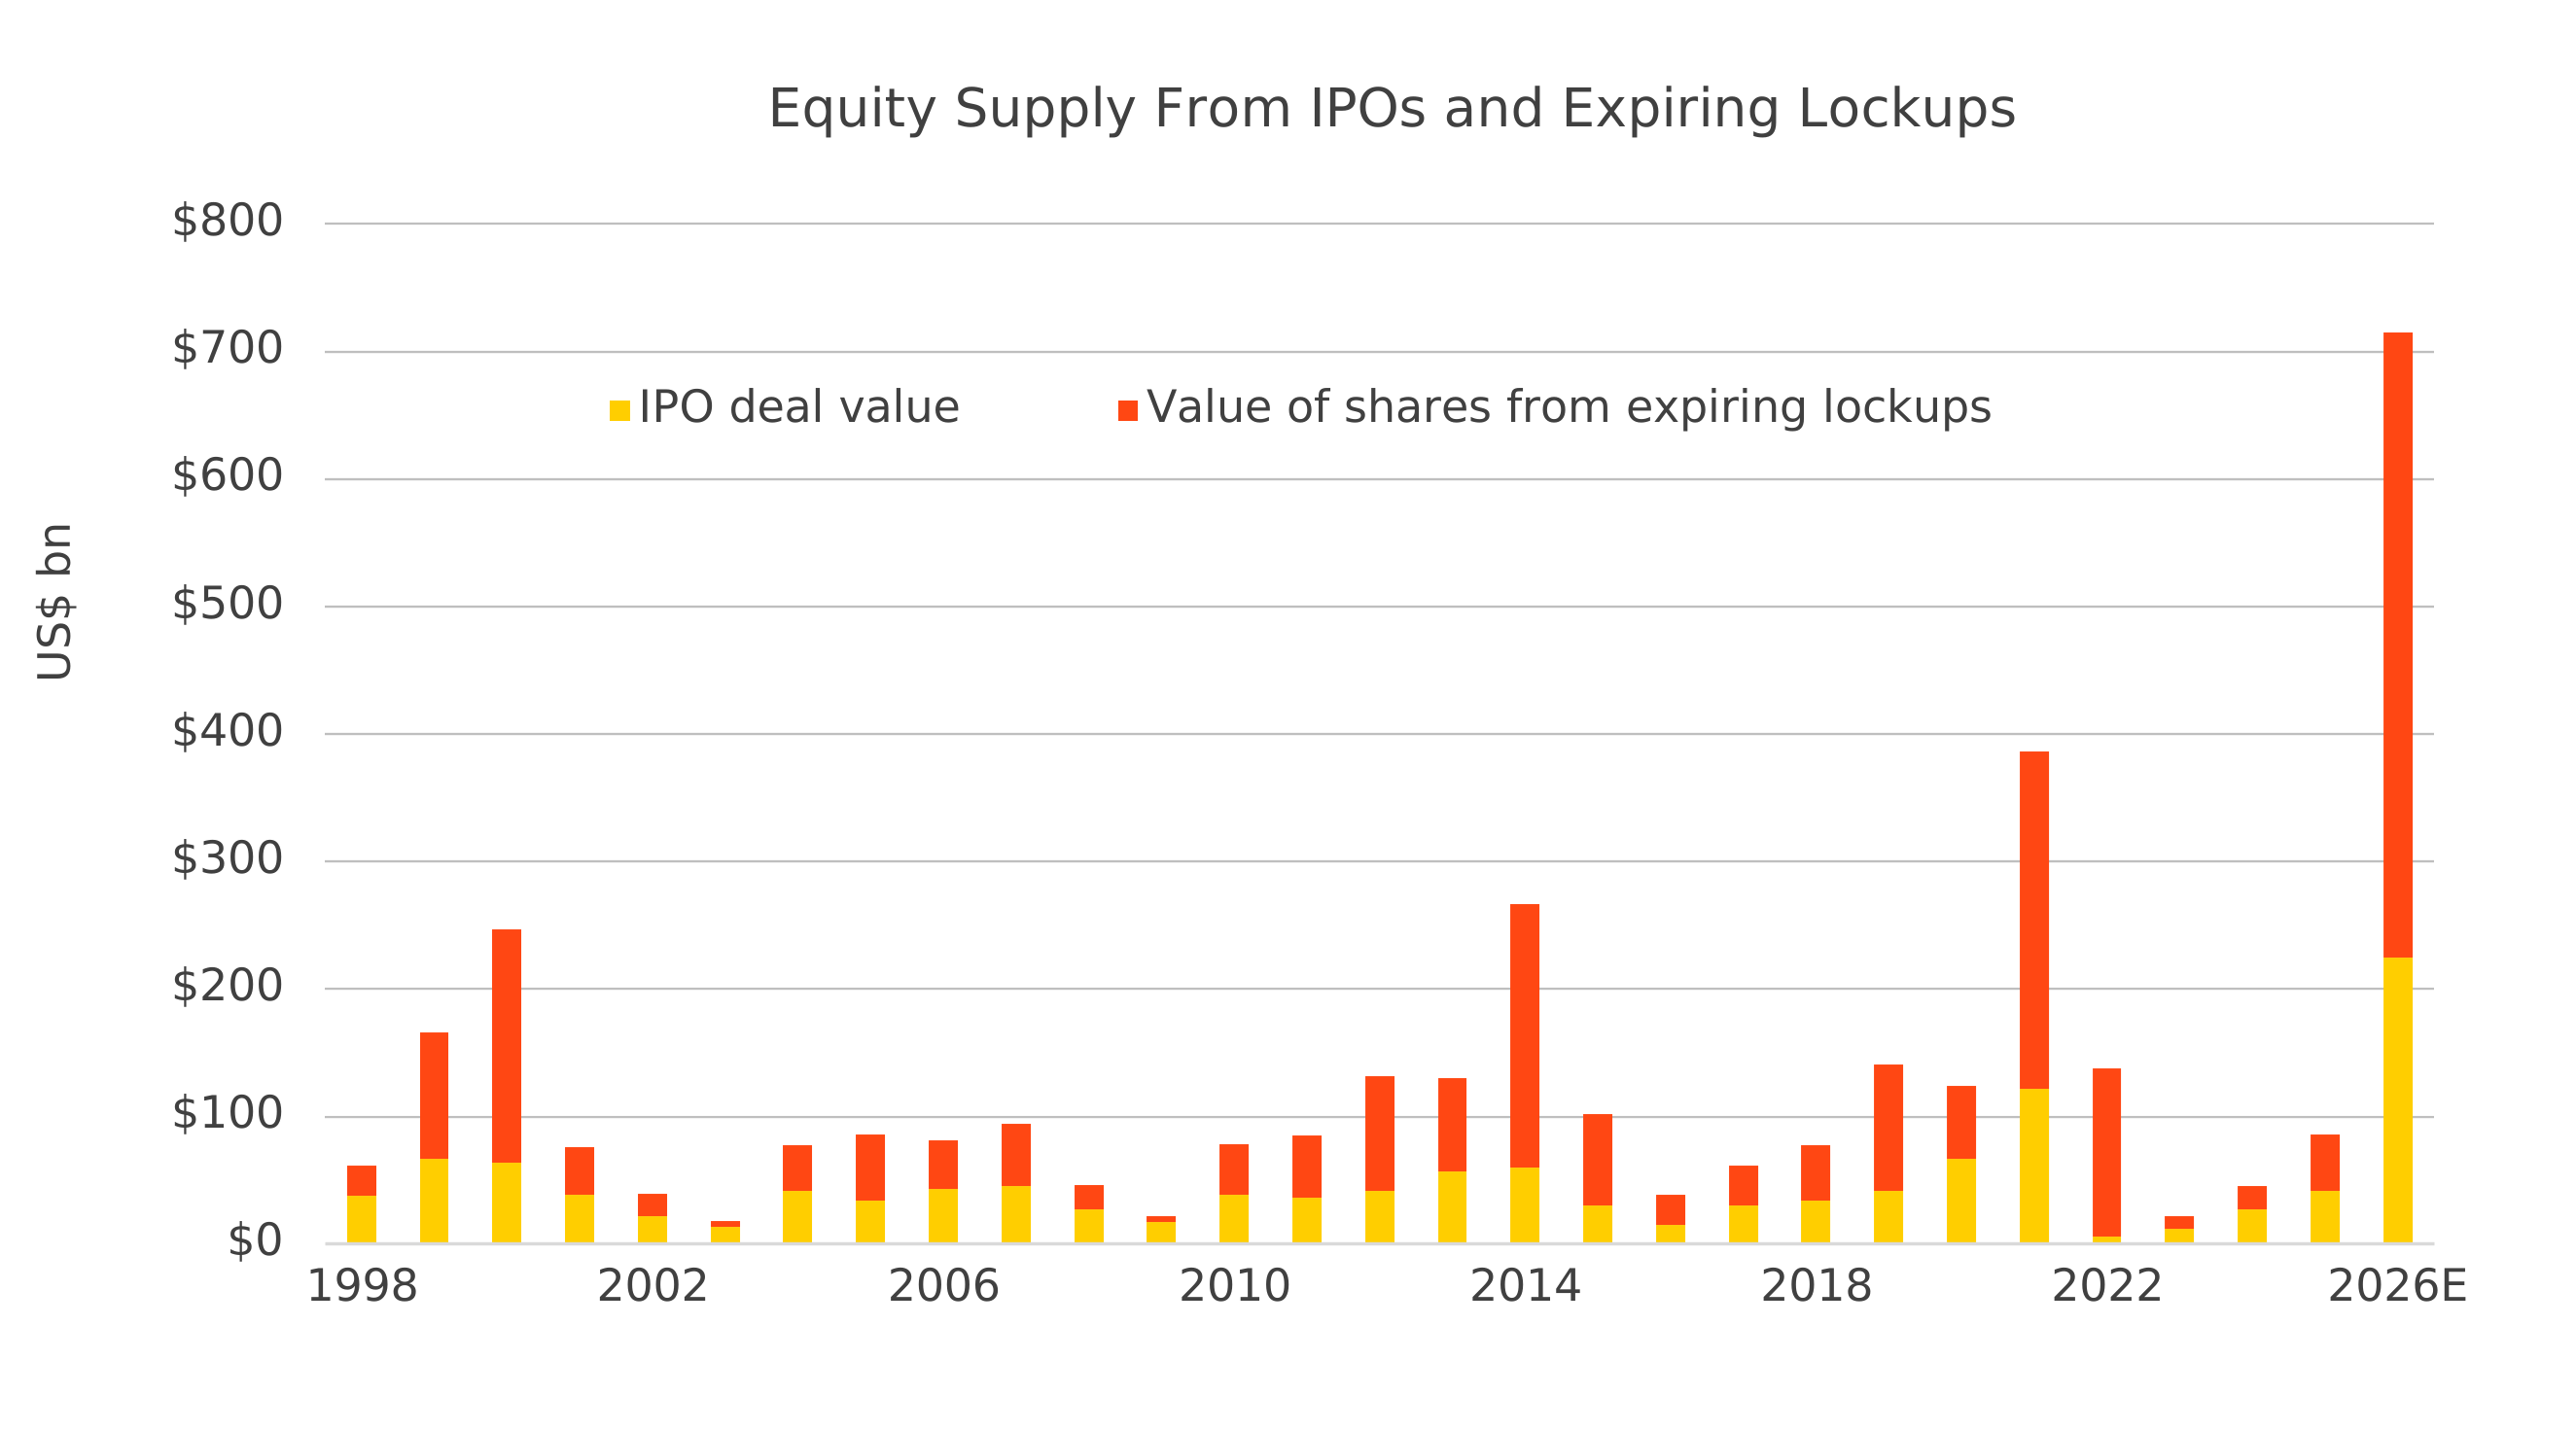
Equity supply includes IPO deal value and value of shares from expiring lockups, shares held by insiders or early investors that become eligible for sale after post-IPO restrictions end.
Goldman Sachs, as of 6/10/2026
Labor market and consumer data: the headline is not the whole story
The labor market looks firm at the headline, 172,000 jobs added in May is undoubtedly strong after a softer spell earlier in the year. The recent strength needs to be respected by both markets and the Fed, but the mix continues changing underneath.
The broader employment picture is much less clean. Employment has decoupled from real GDP in a way that looks unusual compared to any point in the last 50 years. Healthcare is the bulk of job growth. Some industries are growing output without adding labor, while many continue to struggle with weak employment and stagnant output. This is not a simple picture of a hot labor market.
AI helps explain the split here, too. The physical buildout supports nonresidential construction, power, grid, and contractors. Adoption compresses repeatable cognitive work in insurance, finance, distribution, and other information-based industries. Travelers Co. is a useful company-level example, not because it proves an economy-wide labor thesis by itself, but because it shows the mechanism clearly: the company has described their claims call center population down by a third, consolidation of four call centers to two, and a more than 30% reduction in average handle time. That dynamic of companies discovering how to increase output with lower labor intensity is still in the early innings for the wider economy.
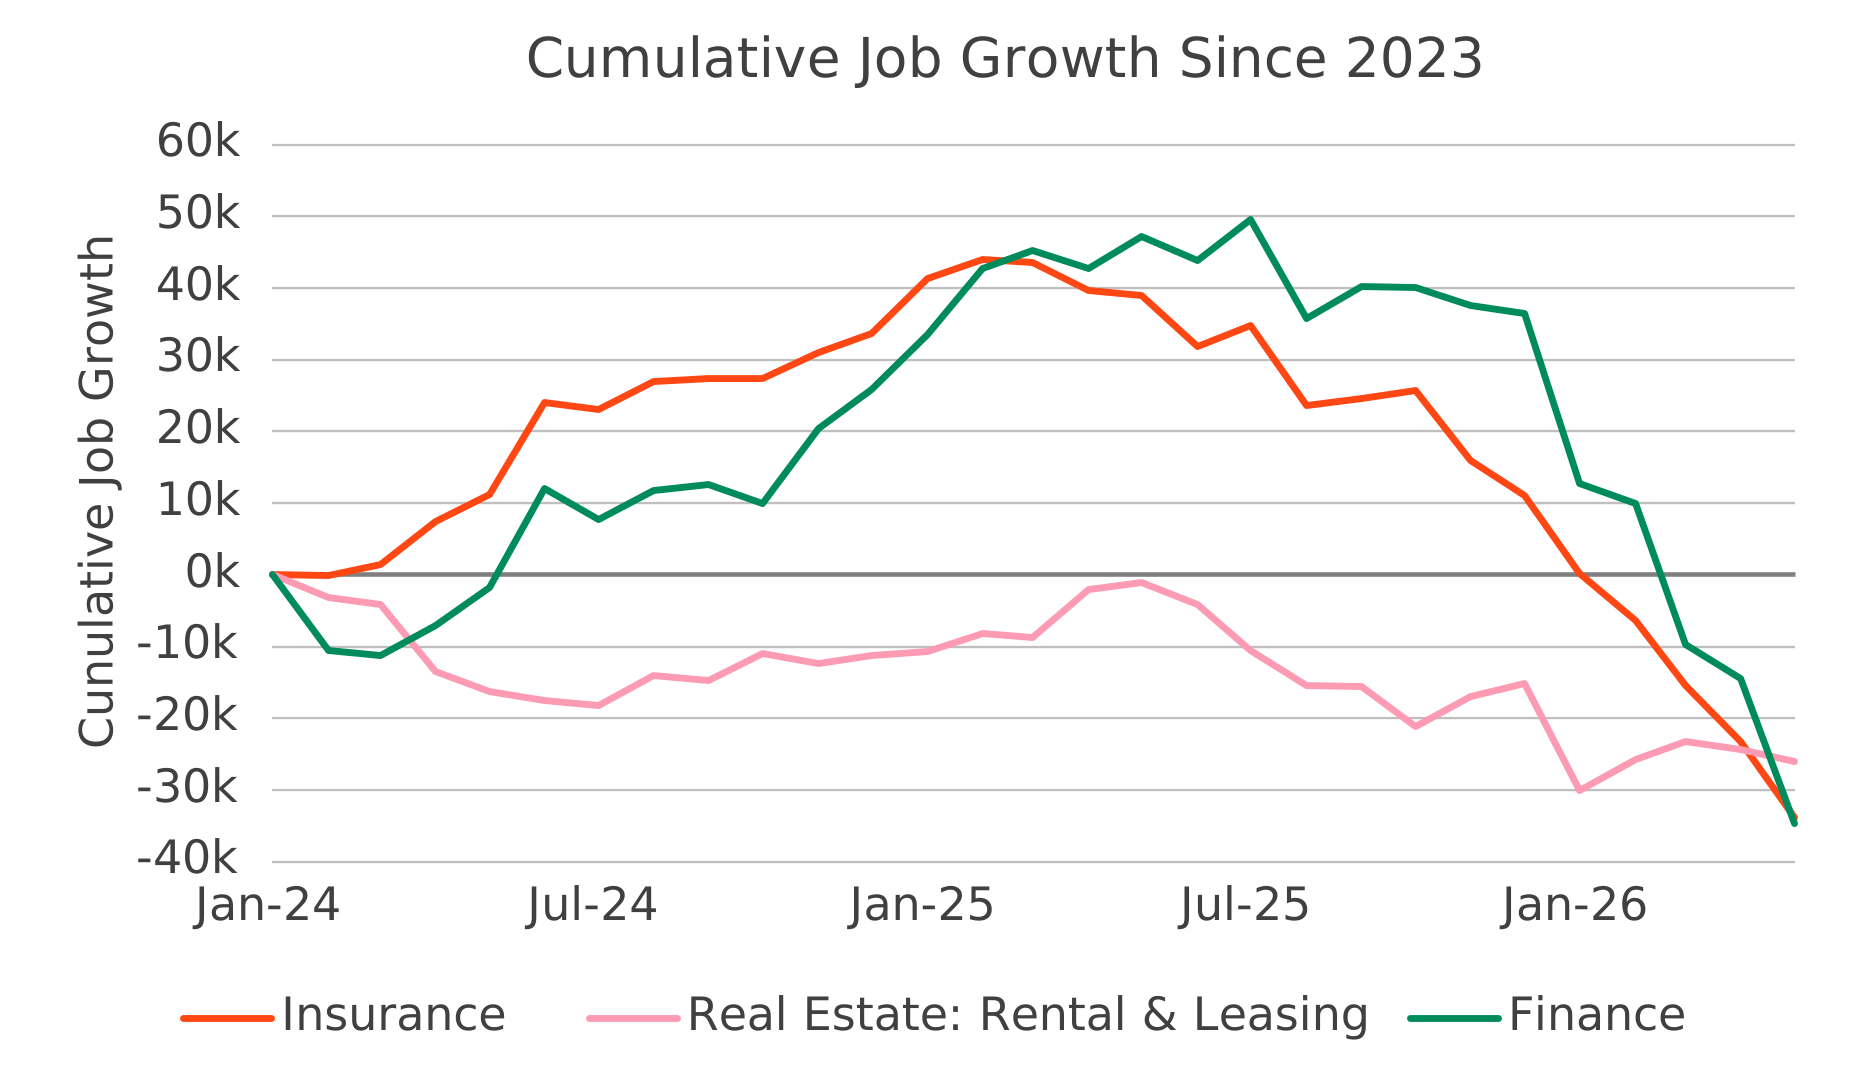
Bureau of Labor Statistics, as of 5/31/2026
The consumer picture has a similar problem. Calling this a K-shaped economy may be the wrong metaphor, a K implies two sides that carry similar weight. The better image is a three-month-old cake: the icing still looks good from the outside, even as the layers inside are struggling. The top 20% of earners now hold 72% of net worth, and households over 55 now account for 40% of consumer spending. That top layer can keep aggregate consumption looking healthy for some time, even as the average household feels more strain.
Underneath, the pressure is more visible. Real income growth has turned negative. Tax support that helped offset the energy shock is fading. Buy Now Pay Later usage has risen, including for groceries, and the share of users paying late has climbed to 47%. Credit card delinquencies have climbed to a post-GFC high of 13.1%, versus the GFC peak of 13.7%.2 This isn’t to say a recession is imminent. It says the aggregate consumer is not the same thing as the marginal household, and policy is hitting those two realities very differently. Higher rates are already pressuring borrowers, housing, and lower-income consumers, while the companies powering the AI capex cycle (and therefore growth) are far less sensitive to small changes in the risk-free rate. That is the core policy problem: the tool is powerful, but the impact is uneven.
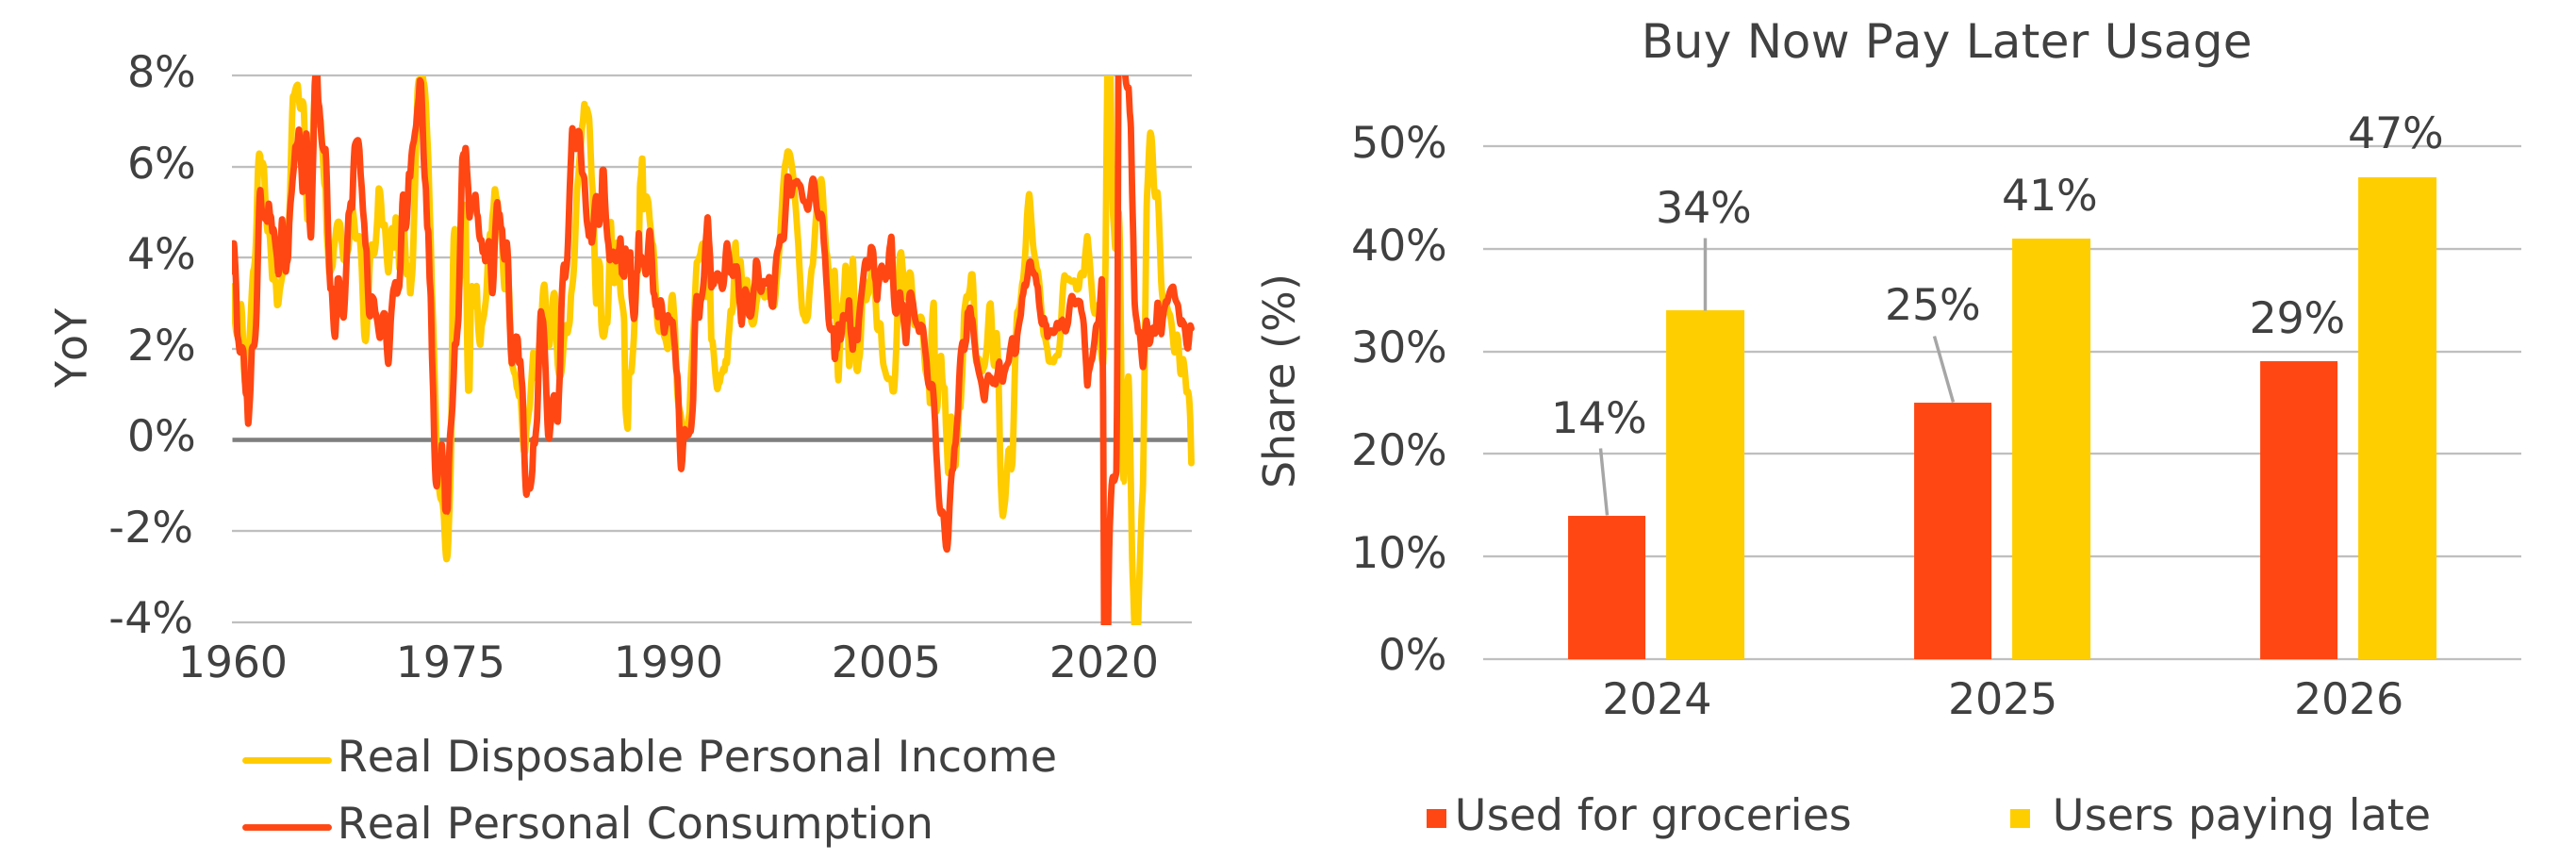
Bureau of Economic Analysis, and Goldman Sachs, as of 4/30/2026
Lending Tree, as of 5/20/2026
Interest rates and inflation: the policy tool is powerful, but uneven
The top 10 U.S. companies now have a combined market capitalization of nearly $22 trillion, equal to 86% of nominal GDP. Their average gross margin is 59%, their net income margin is 30%, their return on equity is 57.5%, and their weighted average cost of debt is 4.3%.3
For companies with those economics, small moves in the risk-free rate are not likely to decide whether to fund an AI investment cycle. The future cash-flow opportunity is too large. That same rate, however, matters enormously for households, small businesses, and housing-related industries that still need to borrow. The Fed funds rate is still powerful, just not where this cycle is most powerful.
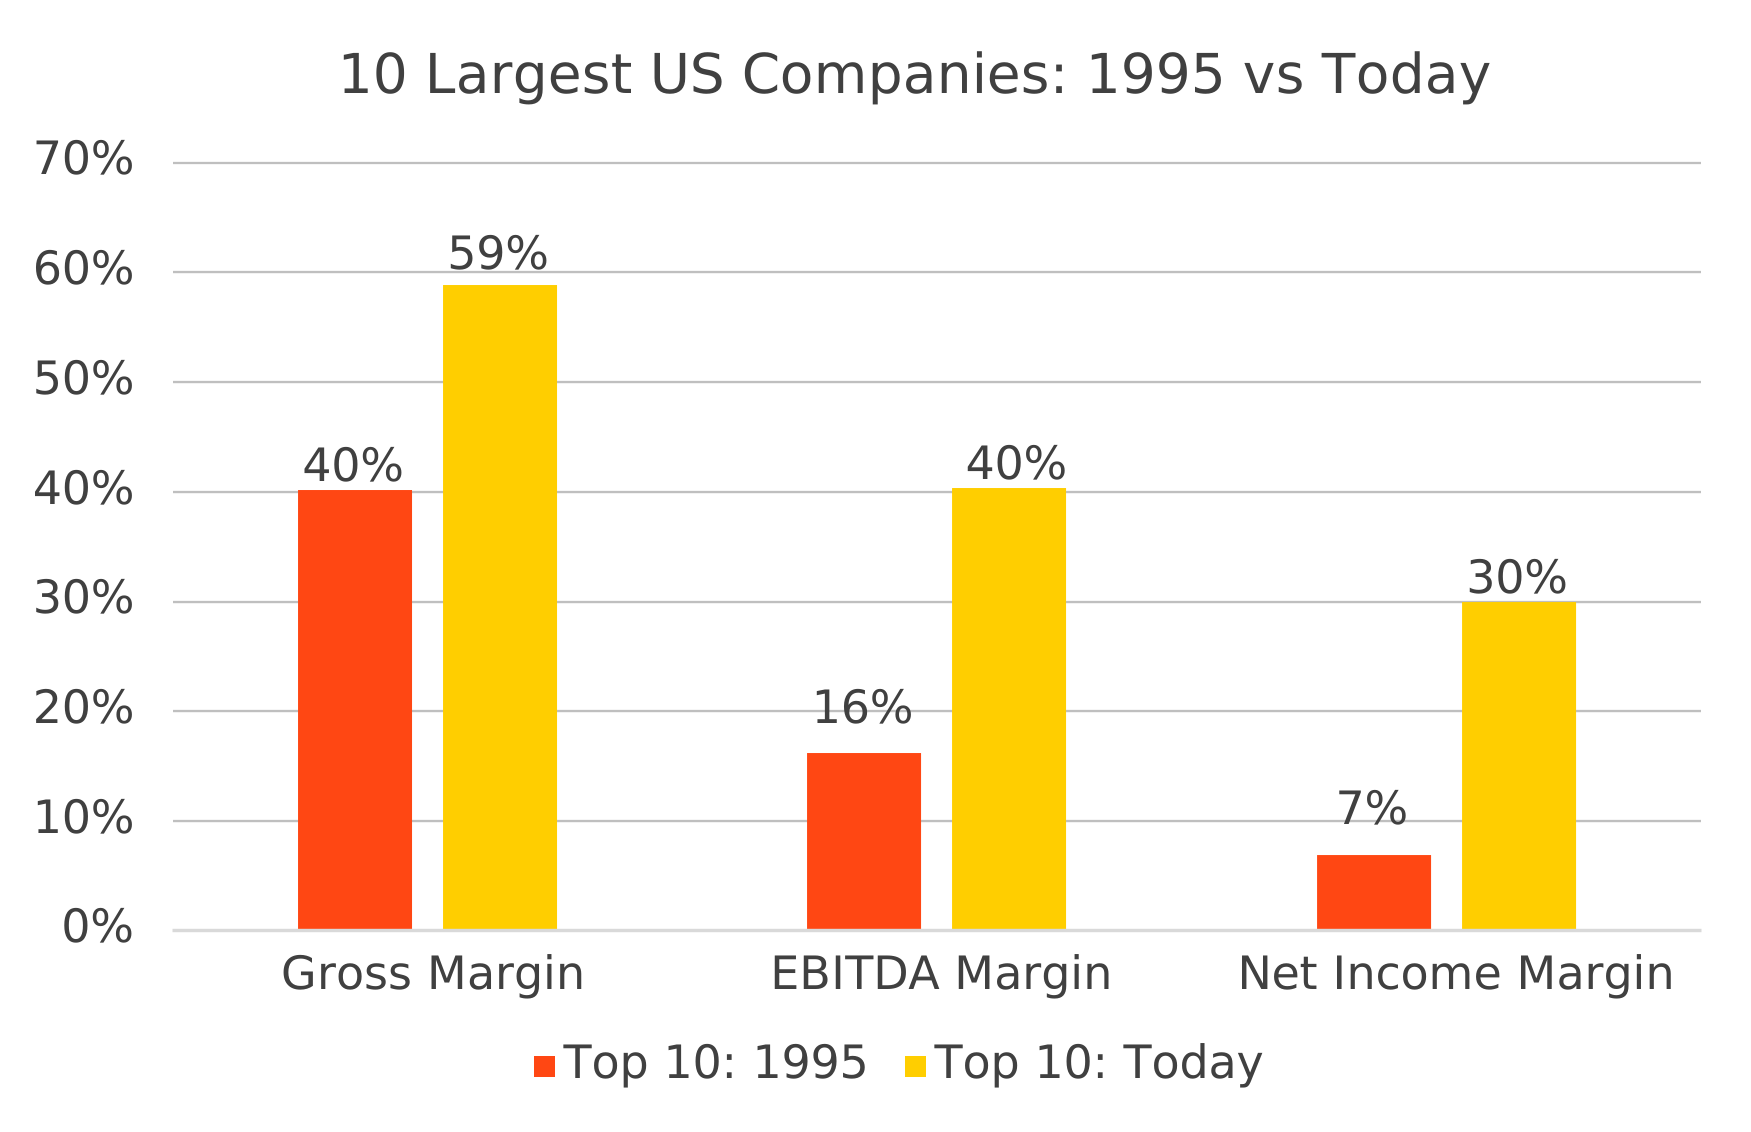
Bloomberg, as of 3/31/2026
Inflation also deserves more than a headline read. Services excluding shelter are trending lower, core goods are lapping tariff effects, and trimmed mean measures remain contained near 2%. At the same time, the categories still driving inflation are largely rate-insensitive: medical care, education, shelter, and energy. Another rate hike does not extract more oil or build more homes. That is the practical limit of the tool.
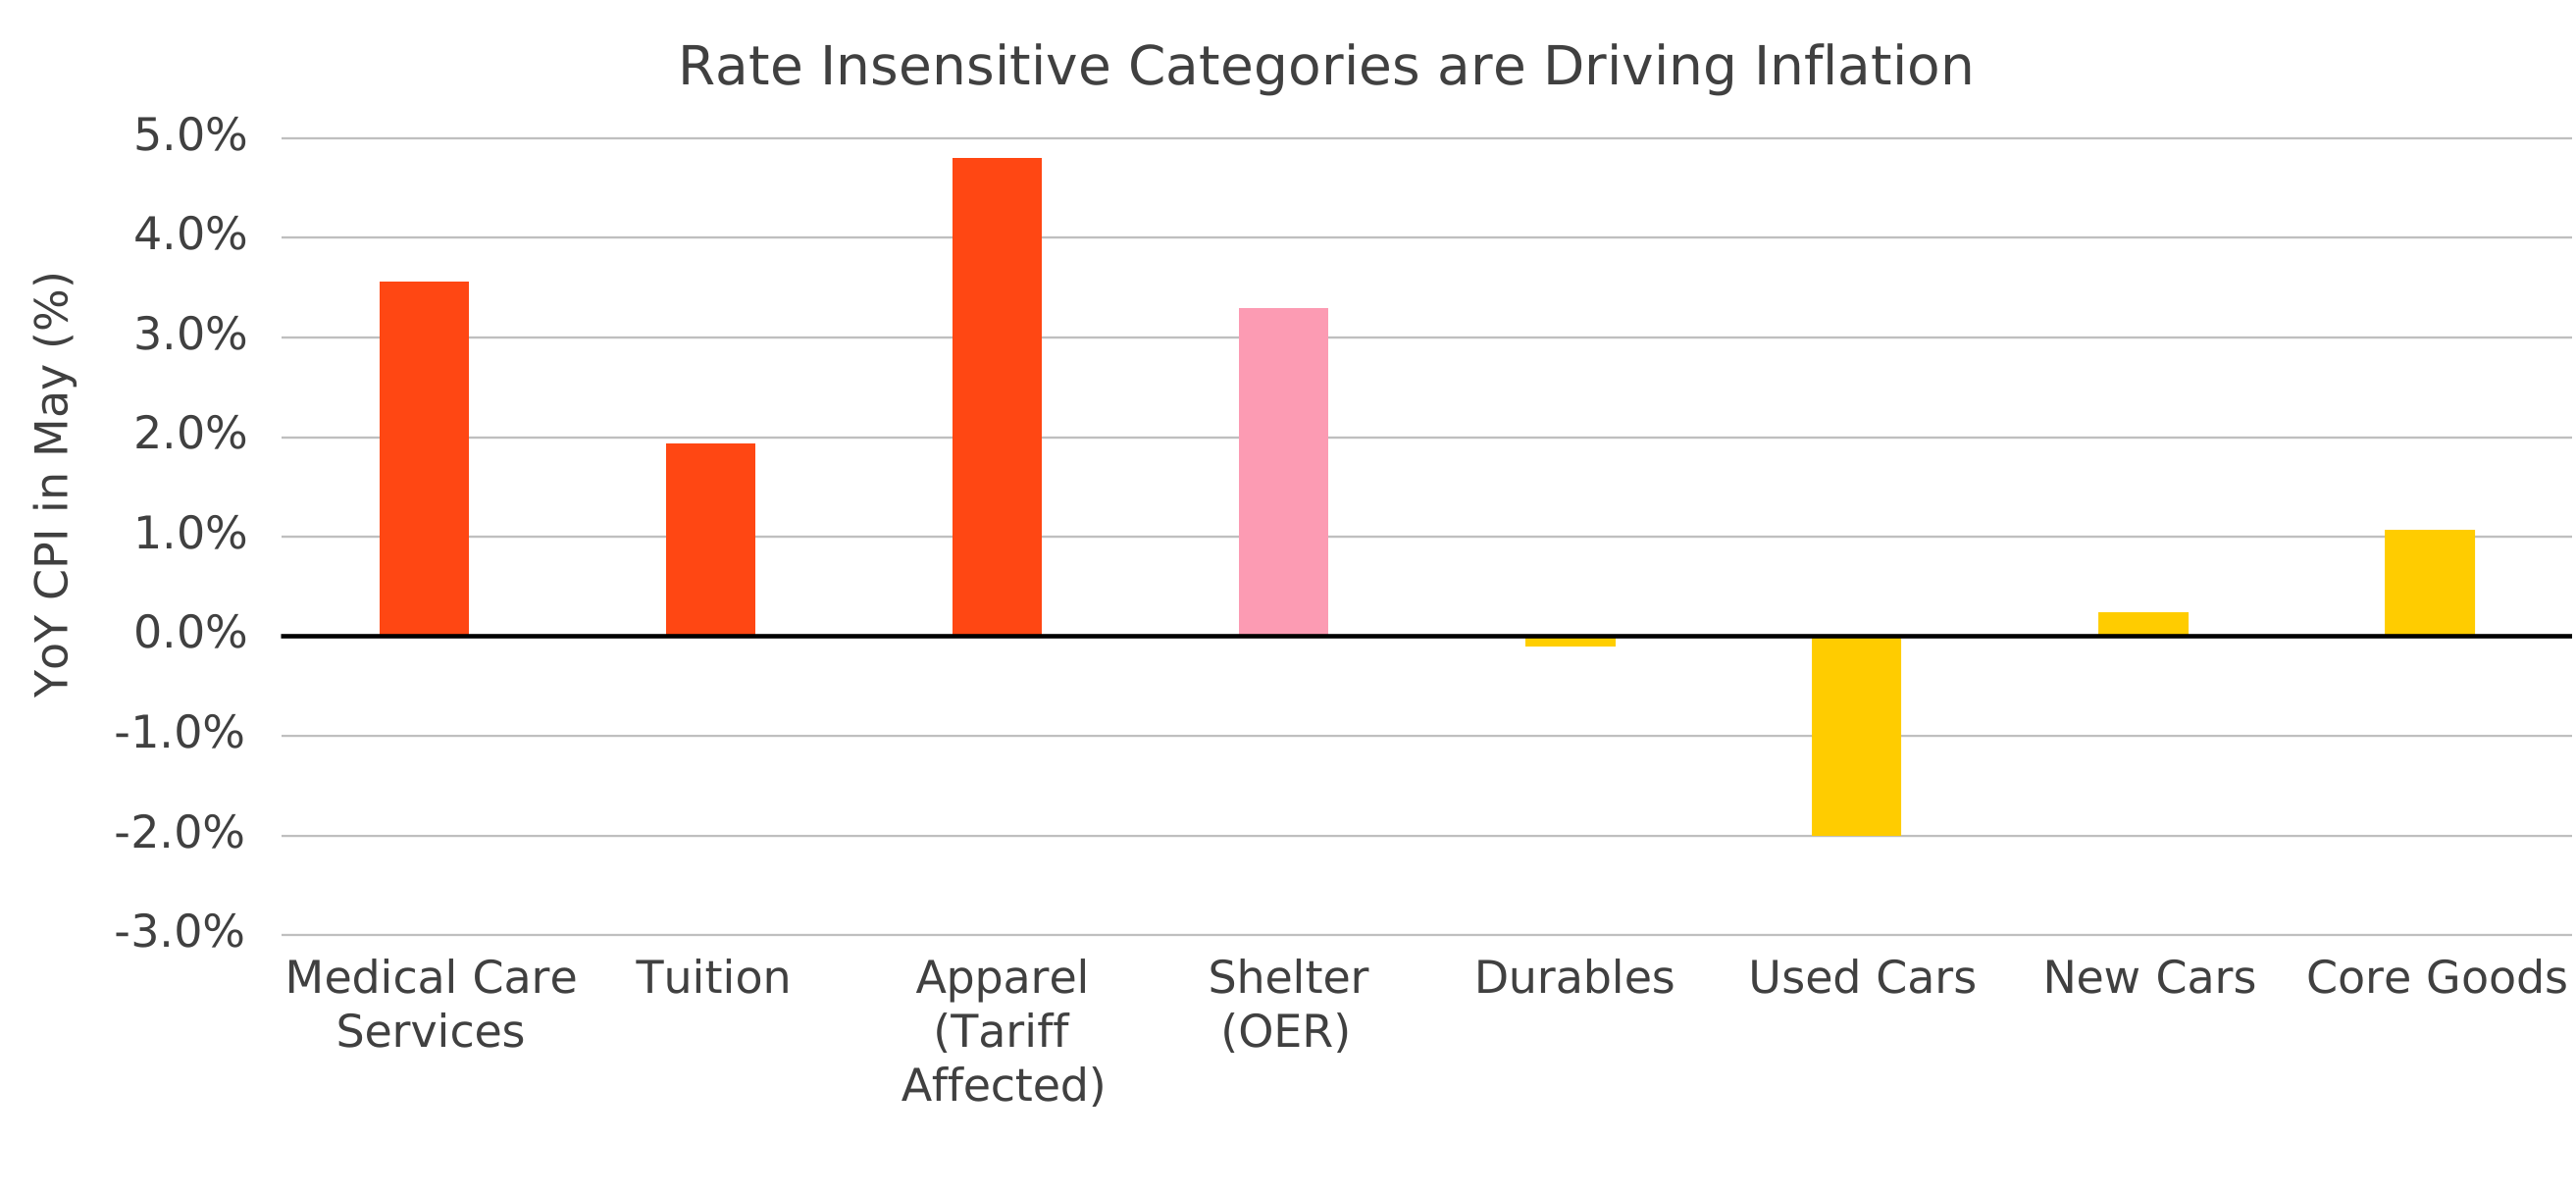
Bureau of Labor Statistics, as of 5/31/2026
Near term, policy still has an inflation-fighting bias. The new-look Fed is inheriting inflation that remains above target and an employment backdrop that still looks decent in aggregate, so a hawkish stance is very understandable. But the more important message from Chair Warsh’s first meeting is on the longer-term philosophy: less forward guidance, more selective communication, deeper analysis of where employment and inflation are heading, and a broader toolkit that includes the balance sheet and money supply. That does not automatically mean more volatility. In fact, better analytics, less Fed-speak, and a wider task-force process could reduce the day-to-day noise. However, when the data truly turns markets will have fewer official signposts and may reprice more sharply. For portfolios, that argues for income and flexibility first, but it also means preparing to add rates and real-rate exposure at some point as valuations stay attractive and the growth and inflation data move closer to validating the turn.
Fixed income yields: income has a job again
We are not advocating for a massive duration bet, but the bar for adding rates exposure is getting lower. Europe may be the cleaner trade right now, growth sentiment looks softer, market pricing still looks relatively hawkish, and hedged sovereign carry has become more compelling.
The U.S. case is also building. Real yields remain elevated, inflation expectations have been stable, and if disinflation continues while growth slows at the margin, building real-rate exposure should become more attractive at some point.
Current yields create a substantial cushion. Even in a bearish scenario where the Fed hikes 100 basis points, one-year broad bond returns are still modestly positive. Yields would need to rise another 75 to 80 basis points before total returns turn negative. When starting yields are low, price appreciation needs to do some heavy lifting to get a respectable return. When starting yields are this high, time and carry can do more of the work.
Fixed income is a full-court game again. A narrow opportunity set focused only on duration is too limiting when credit, global rates, securitized assets, convertibles, volatility markets, and bespoke transactions all offer different forms of compensation. The common thread is not reaching blindly for yield. It is asking whether collateral, covenants, structure, and compensation line up.
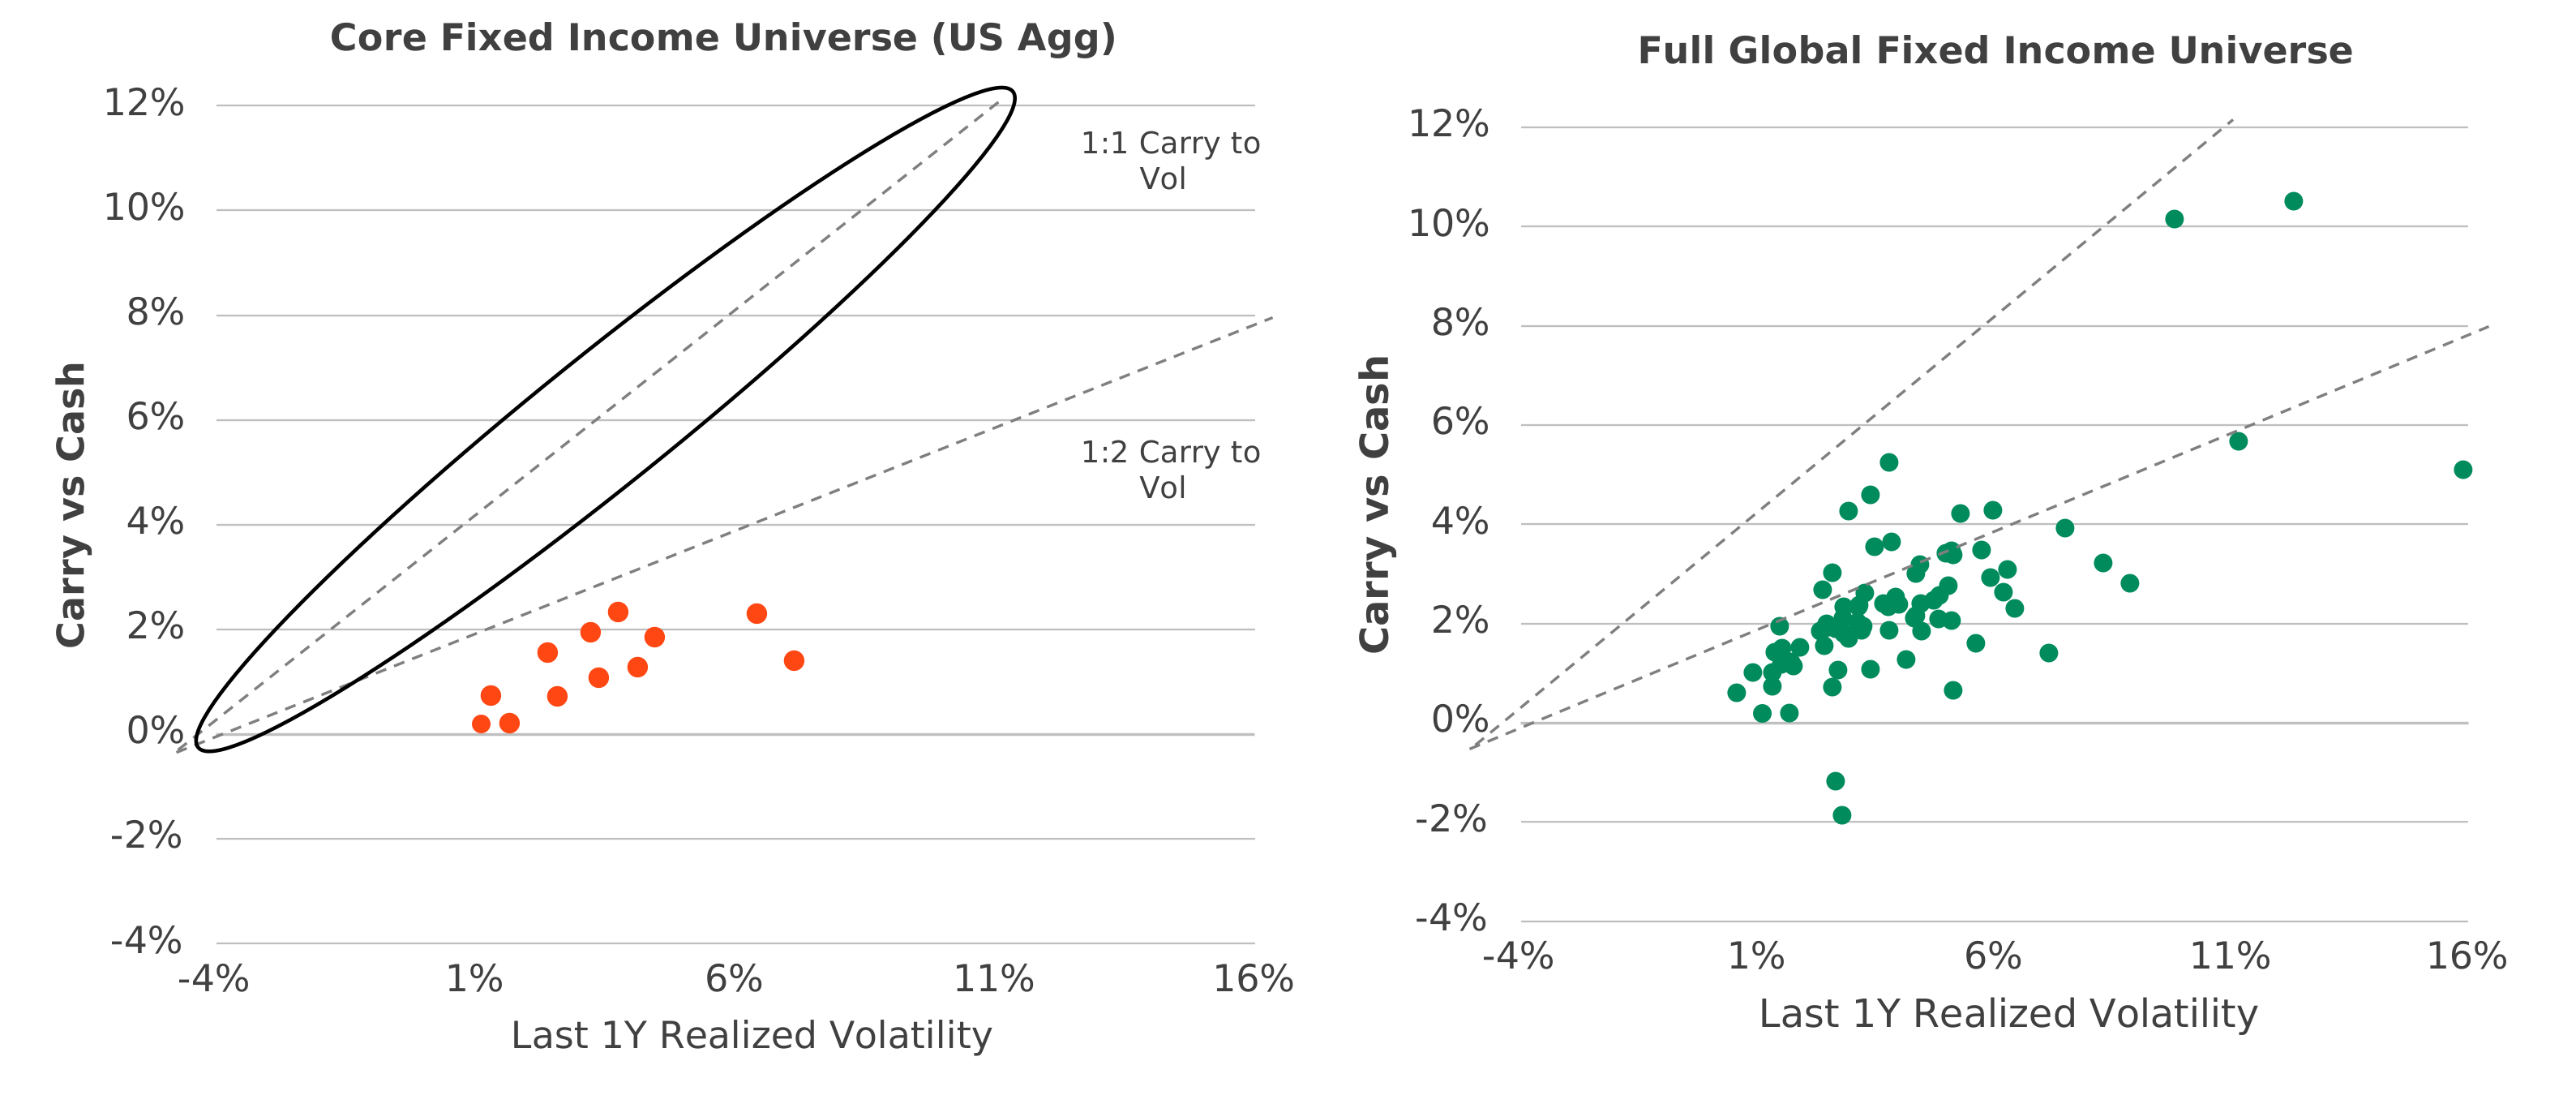
Carry: a bond’s income and expected price appreciation over a given holding period
Bloomberg, as of 6/12/2026
Equity market outlook: not a bubble, not forgiving
We still reject the notion that this equity move is simply a bubble, because the earnings growth is real. Since October, returns in technology, semiconductors, and the Magnificent 7 have been driven meaningfully by forward earnings growth, not just multiple expansion. Valuations haven’t blown out either: the Magnificent 7 forward price-to-earnings ratio has moved from 34.1 times at year-end 2025 to 25.8 times today, while technology and semiconductors have also absorbed meaningful compression from prior extremes. Getting serious in equities means rejecting lazy bubble language without ignoring the higher hurdle.
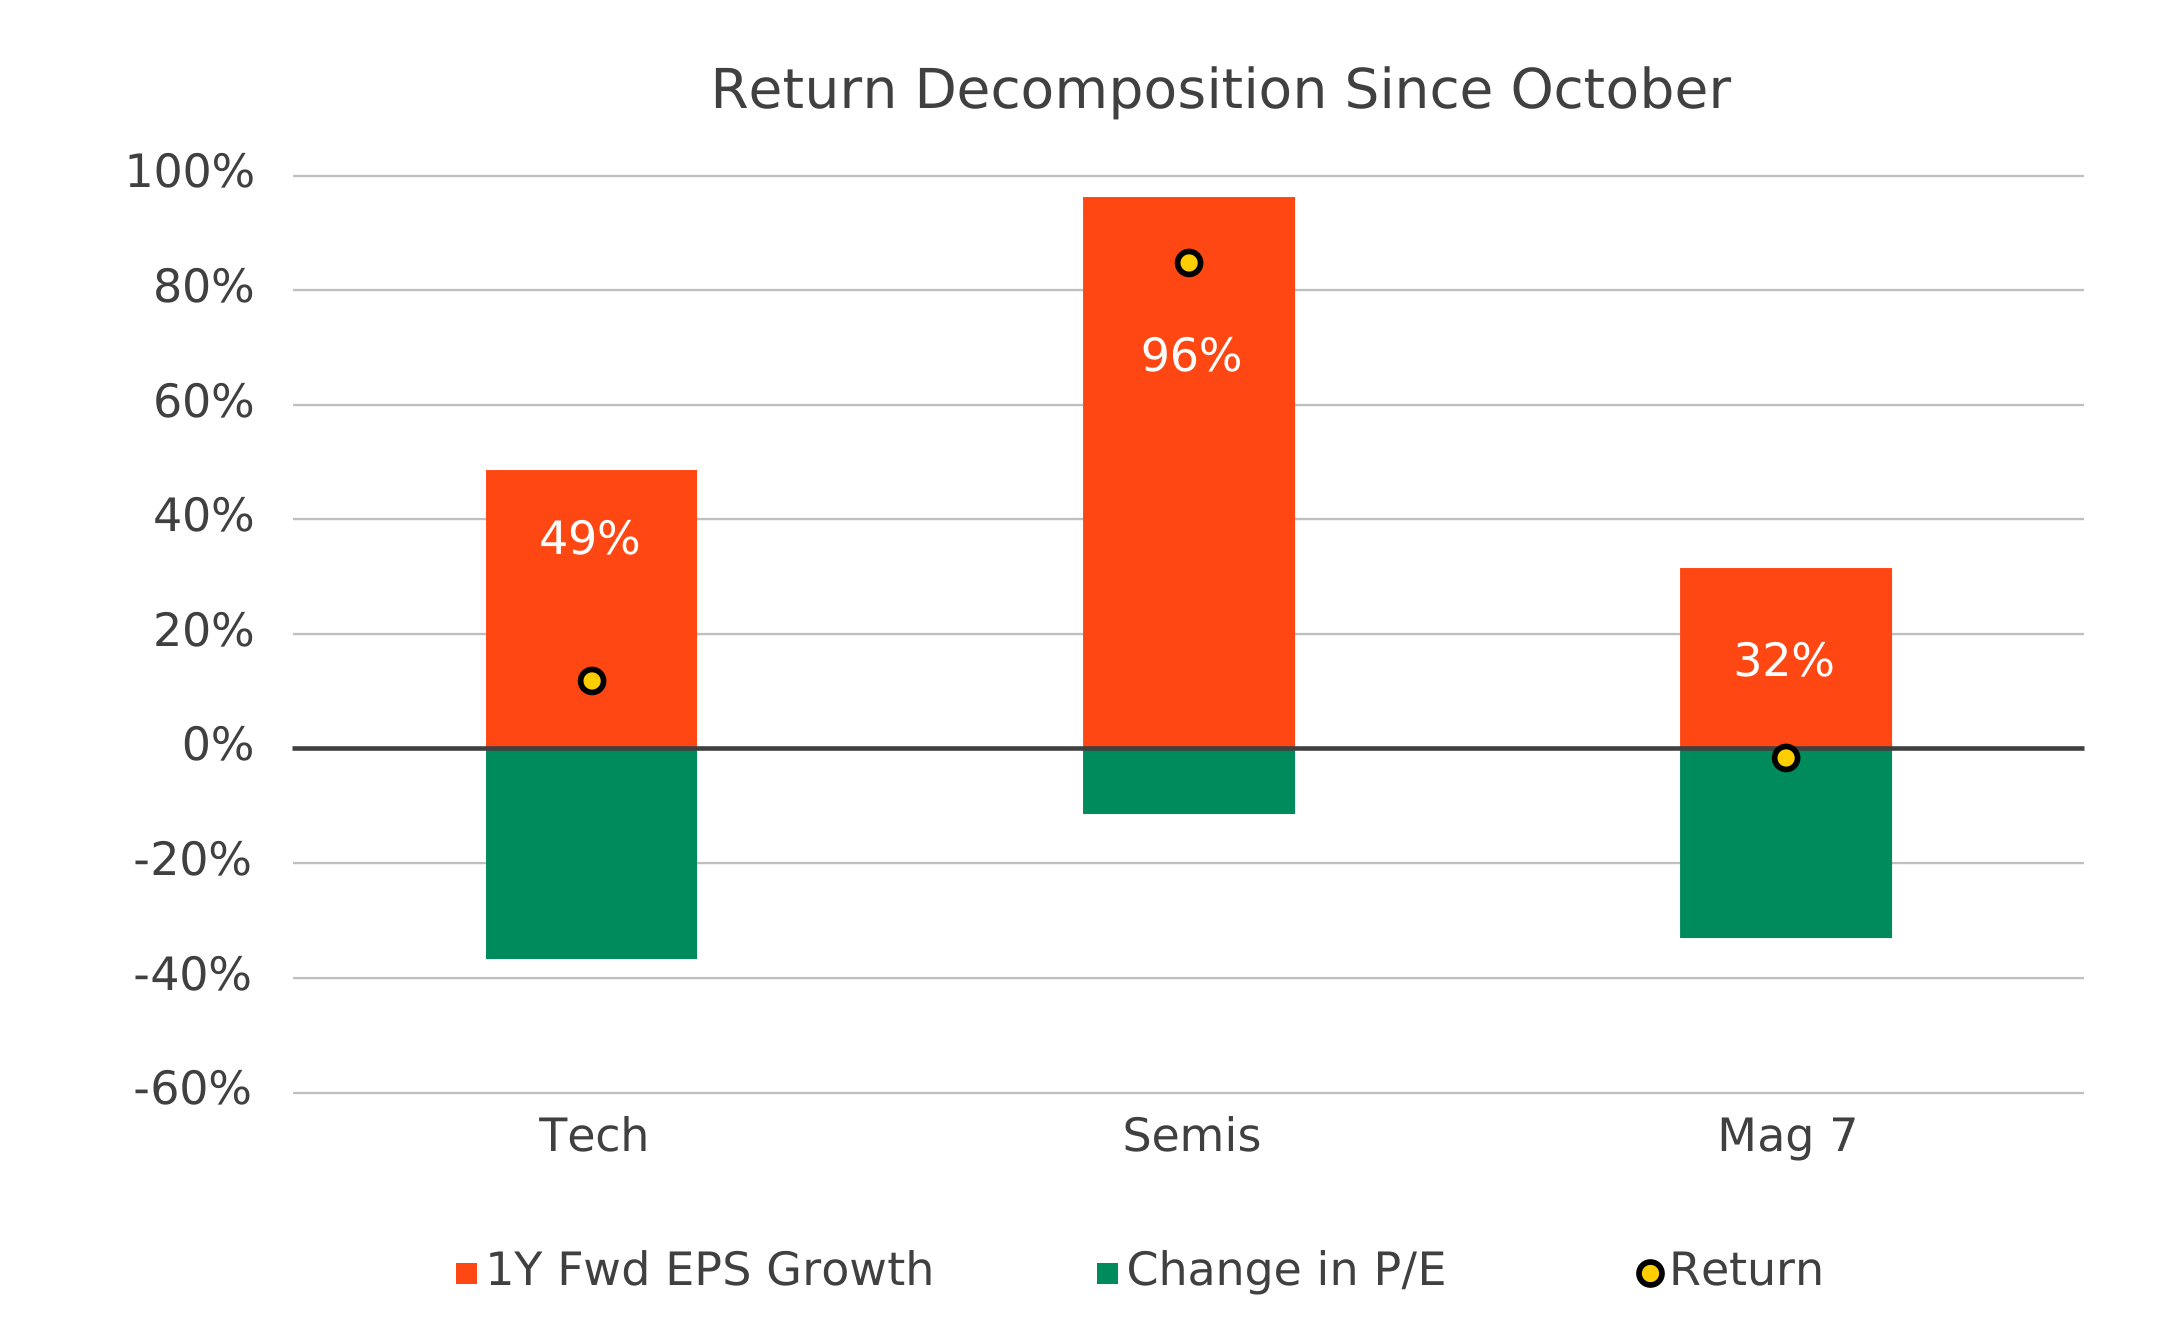
Bloomberg, as of 6/16/2026
The better framing is that equities are no longer forgiving. After setting the bar extremely high earlier this year, the S&P 500 requires a structurally higher level of earnings growth to achieve similar annual returns over the next decade. That does not make stocks unattractive, it means the hurdle is higher. Strong earnings can still support strong returns, but slowing momentum, increased supply, or modest earnings disappointments matter more when expectations are elevated.
We are very respectful of the fact that there is an immense amount of capital seeking equity-like returns, and very few asset classes can deliver them at scale. The top 10 U.S. stocks are larger than every non-U.S. equity market combined, and larger than any non-U.S. economy. That supports the case for exceptional companies with durable cash-flow growth. It does not support owning broad beta without asking what is already priced.
Volatility markets can help investors stay invested with more precision. Technology, semiconductor, and single-name volatility all remain elevated relative to broader index volatility, creating tactical opportunities in the options market. This is not a situation where investors need to abandon equities, but precision and dynamism will matter a lot more.
Portfolio positioning: get serious, not defensive
Risk premia have roared back after the March lows. Credit spreads are thin again, but all-in yields still give fixed income more cushion than spreads alone imply. Equities have recovered too, but valuations alone aren’t cause for concern, and the earnings story is still doing real work. The opportunity is not gone, the margin for error is just narrower.
That is the point of getting serious: not to cut risk indiscriminately or hide in cash, but to be more deliberate. We don’t want to confuse a slowing rate of change with a downturn, but we also don’t want to treat this like the same broad beta trade that worked earlier in the year. Earn income while starting yields still matter, while being ready to add duration as valuations and fundamentals improve. Keep equity exposure where cash flows are growing and durable while being willing to trim the most extended winners. Own risk where the compensation is clear, and stay flexible as policy, supply, and geopolitics keep moving the tape.
The risk is not being invested. The risk is being imprecisely invested after the broad move has already happened. Income, balance, selectivity, and flexibility are what serious portfolio construction looks like when every unit of risk has to earn its keep.
The performance quoted represents past performance and does not guarantee future results. Investment returns and principal values may fluctuate so that an investor’s shares, when redeemed, may be worth more or less than their original cost. Current performance may be lower or higher than the performance data quoted. All returns assume reinvestment of all dividend and capital gain distributions. Click on the fund tile to obtain performance data as of the most recent quarter end and current to the most recent month-end.
The Morningstar Rating for funds, or "star rating", is calculated for managed products (including mutual funds, variable annuity and variable life subaccounts, exchange-traded funds, closed-end funds, and separate accounts) with at least a three-year history. Exchange-traded funds and open-ended mutual funds are considered a single population for comparative purposes. It is calculated based on a Morningstar Risk-Adjusted Return measure (excluding any applicable sales charges) that accounts for variation in a managed product's monthly excess performance, placing more emphasis on downward variations and rewarding consistent performance. The top 10% of products in each product category receive 5 stars, the next 22.5% receive 4 stars, the next 35% receive 3 stars, the next 22.5% receive 2 stars, and the bottom 10% receive 1 star. The Overall Morningstar Rating for a managed product is derived from a weighted average of the performance figures associated with its three-, five-, and 10-year 60-119 months of total returns, and 50% 10-year rating/30% five-year rating/20% three-year rating for 120 or more months of total returns. While the 10-year overall star rating formula seems to give the most weight to the 10-year period, the most recent three-year period actually has the greatest impact because it is included in all three rating periods.

Rick Rieder
Chief Investment Officer of Global Fixed Income and Head of the Global Allocation Investment Team

Russell Brownback
Head of Global Macro Positioning Team within Global Fixed Income

Navin Saigal
Head of Global Fixed Income, Asia Pacific

Dylan Price
Director, Global Fixed Income

Charlotte Widjaja
Director, Global Fixed Income
Investments
Insights
Retirement
Tools
Resources
About Us


1. Bloomberg, as of 06/16/2026. BlackRock defines the “AI 32” as a basket of companies that, based on our qualitative assessment of their businesses, have direct exposure to the development, infrastructure, or adoption of artificial intelligence, including cloud/hyperscale computing, semiconductors and related hardware, data-center and power infrastructure, networking, and software/platform businesses. The classification is based on BlackRock’s assessment and is not a recognized industry classification or third-party index.
2. FRBNY Consumer Credit Panel / Equifax, as of 03/31/2026.
3. Chart shows gross, EBITDA and net income margins only. Market capitalization, share of nominal GDP, return on equity, and weighted average cost of debt are not shown in the chart and are based on Bloomberg data as of 3/31/2026.
Investing involves risks, including possible loss of principal. Past performance is no guarantee of future results. Index performance is shown for illustrative purposes only. It is not possible to invest directly in an index.
Performance data quoted represents past performance and is no guarantee of future results. Investment returns and principal values may fluctuate so that an investor’s shares, when redeemed, may be worth more or less than their original cost. All returns assume reinvestment of dividends and capital gains. Current performance may be lower or higher than that shown. Refer to blackrock.com for most recent month-end performance.
Carefully consider the Funds' investment objectives, risk factors, and charges and expenses before investing. This and other information can be found in the Funds' prospectuses or, if available, the summary prospectuses which may be obtained by visiting www.iShares.com or www.blackrock.com. Read the prospectus carefully before investing.
Fixed income risks include interest-rate and credit risk. Typically, when interest rates rise, there is a corresponding decline in bond values. Credit risk refers to the possibility that the bond issuer will not be able to make principal and interest payments. International investing involves risks, including risks related to foreign currency, limited liquidity, less government regulation, and the possibility of substantial volatility due to adverse political, economic, or other developments. These risks may be heightened for investments in emerging markets. International investing involves risks, including risks related to foreign currency, limited liquidity, less government regulation and the possibility of substantial volatility due to adverse political, economic or other developments. These risks may be heightened for investments in emerging markets.
Stock and bond values fluctuate in price so the value of your investment can go down depending on market conditions. Non-investment-grade debt securities (high-yield/junk bonds) may be subject to greater market fluctuations, risk of default or loss of income and principal than higher rated securities. Asset allocation strategies do not assure profit and do not protect against loss.
Actively managed funds do not seek to replicate the performance of a specified index, may have higher portfolio turnover, and may charge higher fees than index funds due to increased trading and research expenses. There is no guarantee that an active fund will meet its investment objective.
This material is not intended to be relied upon as a forecast, research, or investment advice, and is not a recommendation, offer or solicitation to buy or sell any securities or to adopt any investment strategy. The opinions expressed are as of June 18th, 2026, and may change as subsequent conditions vary.
The information and opinions contained in this commentary are derived from proprietary and non-proprietary sources deemed by BlackRock to be reliable, are not necessarily all-inclusive and are not guaranteed as to accuracy. As such, no warranty of accuracy or reliability is given and no responsibility arising in any other way for errors and omissions (including responsibility to any person by reason of negligence) is accepted by BlackRock, its officers, employees, or agents.
This commentary may contain “forward-looking” information that is not purely historical in nature. Such information may include, among other things, projections, and forecasts. There is no guarantee that any forecasts made will come to pass. Reliance upon information in this post is at the sole discretion of the reader.
Any opinions or forecasts represent an assessment of the market environment at a specific time and is not a guarantee of future results. This information should not be relied upon by the reader as research, investment advice or a recommendation. This material does not constitute investment advice and is not intended as an endorsement of any specific investment.
Investment involves risk. Information and opinions are derived from proprietary and non-proprietary sources.
©2026 BlackRock, Inc. or its affiliates. All rights reserved. BLACKROCK is a trademark of BlackRock, Inc., or its affiliates. All other marks are the property of their respective owners.
FFI0726-5703921-EXP0727