1. What’s driving the stock market higher in 2026, and is now a good time to sell?
Fundamentals have lifted markets higher in 2026, on both the micro and the macro fronts. Even after a strong first-half rally, the move has been supported by resilient growth, improving earnings expectations, and easing pressure from geopolitical risks. Advisors are asking if it’s a ‘good’ time to sell, but we believe the answer is more a question about portfolio positioning.
First let’s unpack market fundamentals. The first tailwind to markets has been a strong economic backdrop, supported by both resilient economic data and continued AI capex spend. Macro held up better than anticipated in H1 across several key areas of data — labor, retail, and housing all came in ahead of consensus forecasts. AI-related spending has added another layer of support: we estimate that it contributed 1.3% to Q1 2026 YoY GDP growth and believe capex spend will remain a near-term tailwind as GDP returns toward long-term trend levels.1 Pair that with geopolitical risks unwinding in the past month, as de-escalation between the U.S. and Iran sent oil prices nearly 40% lower off April highs, pulling both growth and inflation scares down in tandem.
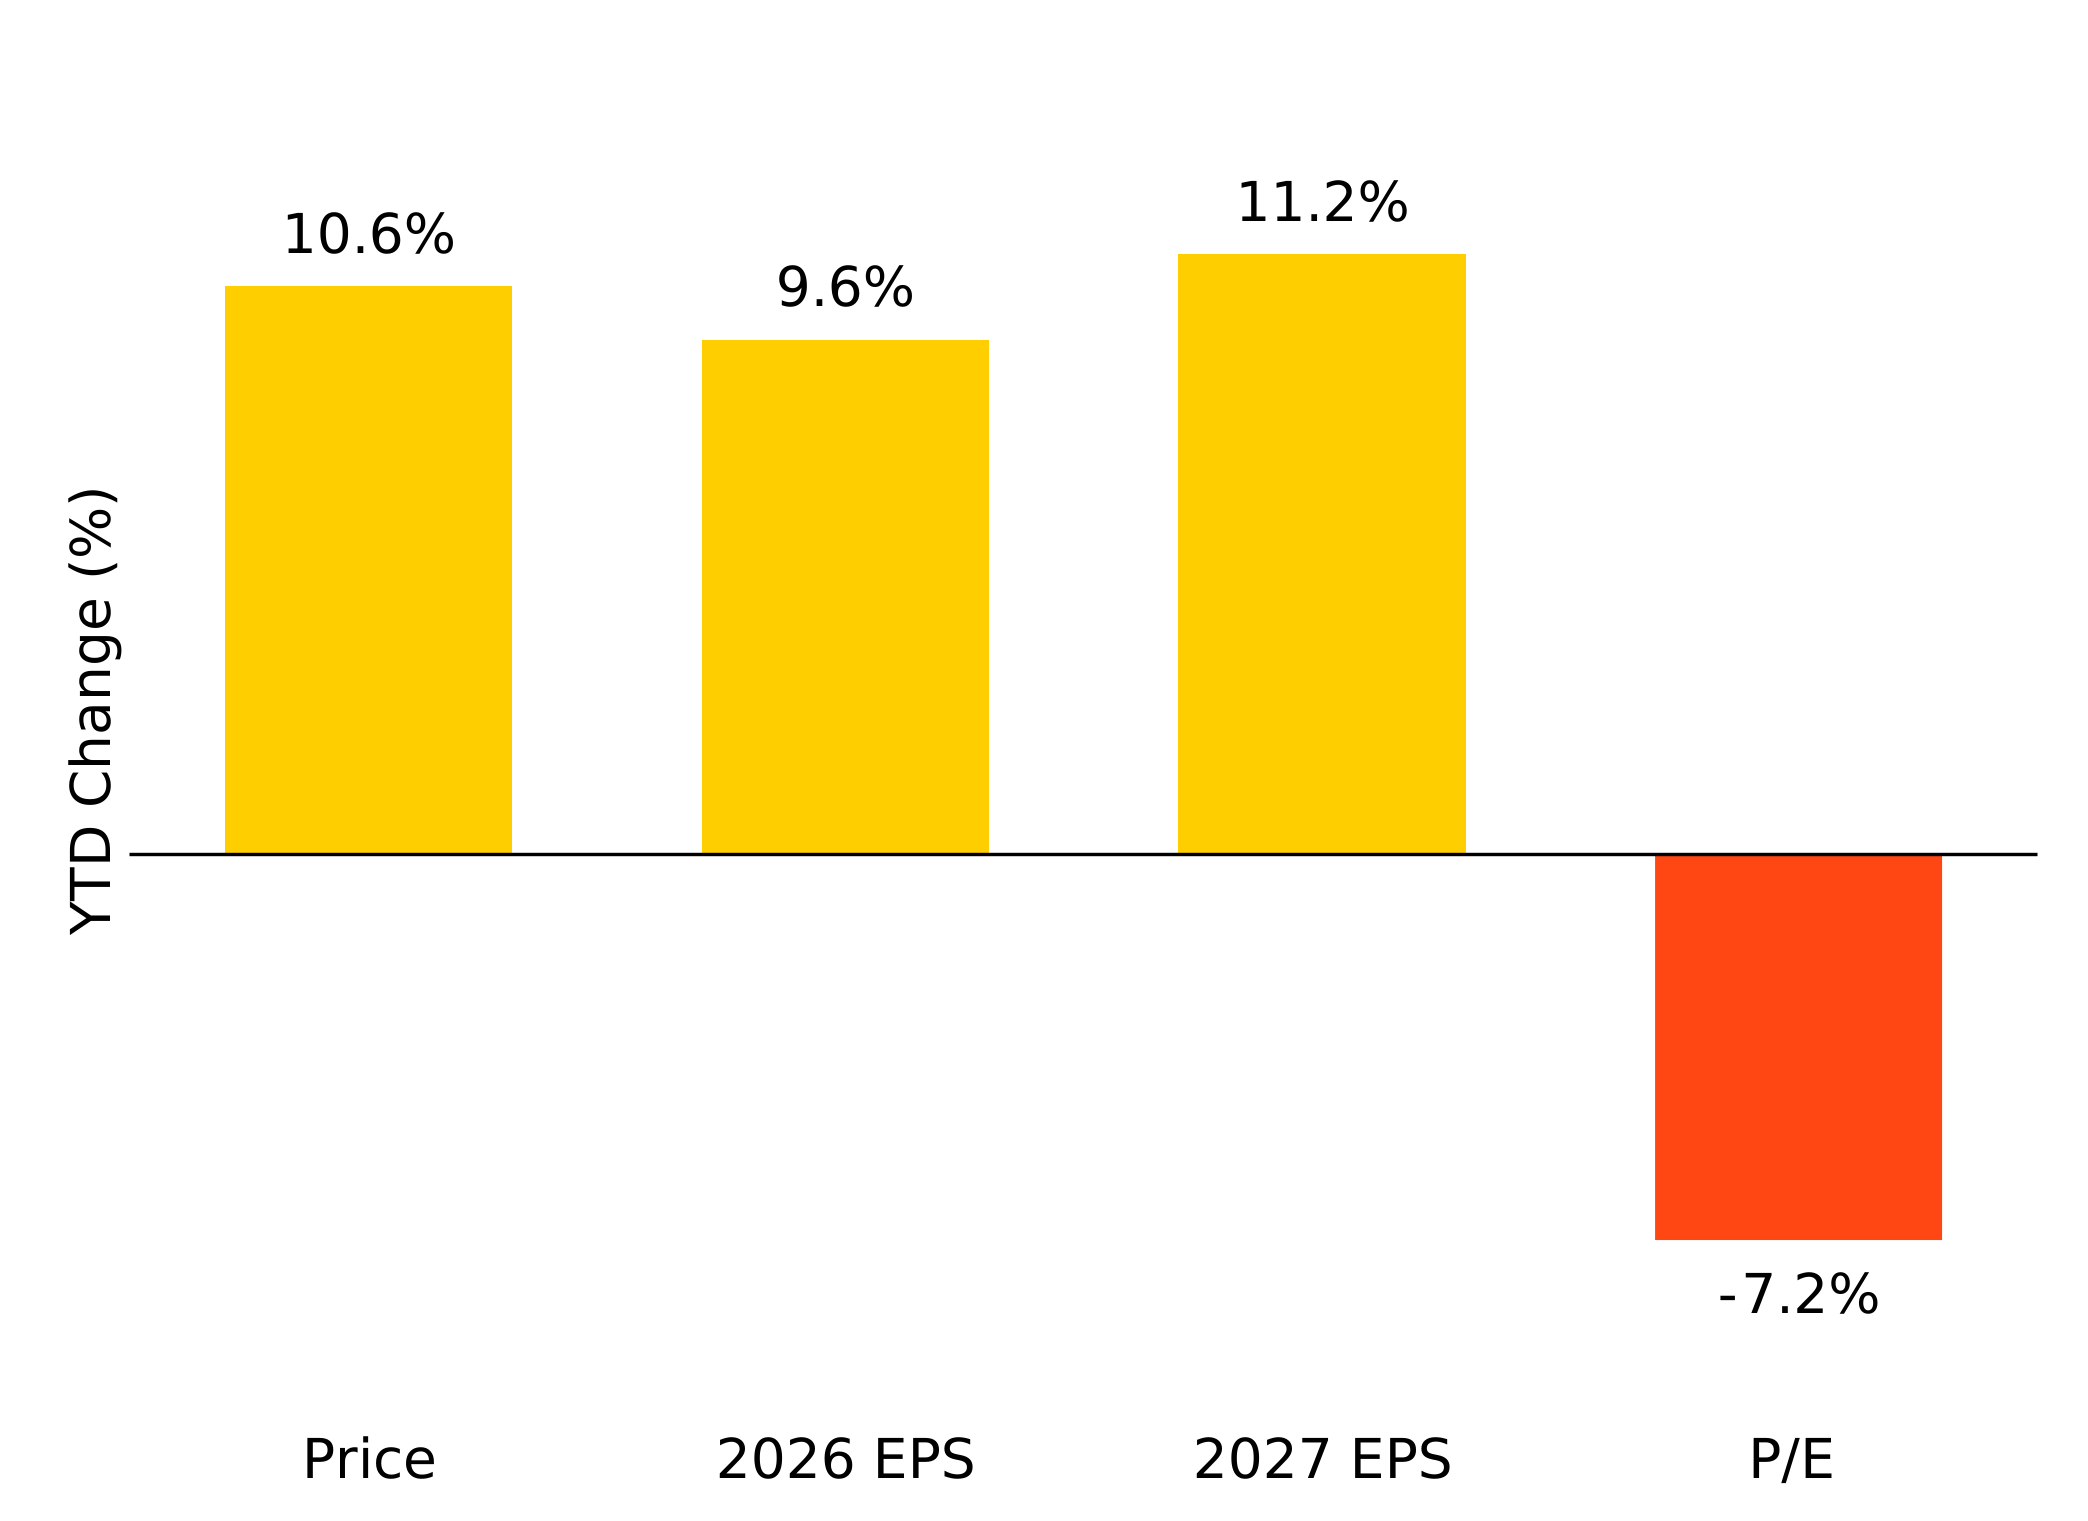
The second catalyst pushing markets higher has been remarkable strength at the micro level. Q1 earnings came in well above expectations, with S&P 500 EPS growth clocking 17%, excluding one-time idiosyncratic benefits.2 Ahead, that momentum should continue — the consensus forecast is for 22% YoY growth in Q2, with AI infrastructure stocks expected to contribute 60% of index-level growth. Thus, as shown in Figure 1, despite the double-digit rally we have seen in the first half of the year, the S&P’s P/E ratio has actually come down, potentially alleviating some valuation concerns and reinforcing that the rally has been supported by earnings, not just multiple expansion.
Figure 1: Resilient macro backdrop led by earnings strength






S&P 500
Russell 1000
Nasdaq 100
MSCI USA
S&P Total Market
Seasoning Period**
12 Months
5 Trading Days
15 Trading Days
10 Trading
days
5 Trading
days
Weighting Scheme
Free-Float Market Cap
Free-Float Market Cap
FF<20%: 3x
FF%;
FF>20%: Full
Listed Mkt Cap
Free-Float Market Cap
Free-Float Market Cap
Fast Track Eligible
No
Yes
Yes
Yes
Yes
Profitability Screen
Yes
No
No
No
No
iShares ETF that seeks to track the index
IVV
IWB
-
-
ITOT
** Seasoning period reflects fast-entry timeline for those that are eligible
See FAQ for definitions
Source: Index providers S&P Dow Jones Indices, MSCI, FTSE Russell, Nasdaq, S&P TMI as of June 5, 2026.