Inside the Market
Stay informed with market recaps, actionable outlooks and timely webinars.

I'm Kristy Akullian, head of investment strategy for the Americas, and I'm here today to walk through our July advisory outlook. Just a few months ago, investors were preparing for a worst-case stagflation scenario. Today, that narrative has shifted meaningfully. Brant crude has fallen over 40% from its April peak.
Traffic through the Strait of Hormuz has begun to rebound and investor sentiment has recovered alongside markets. At the same time, the US economy continues to prove more resilient than expected. Payroll growth is still firm, and while inflation remains elevated, price pressures aren't broad based.
Markets have become more cautious around the Fed's trajectory. Earlier this year, consensus forecasts were expecting the first rate cut to kick off in July. That's now rapidly swung. Markets are pricing meaningful odds of a hike from here, but our view remains that easing energy prices should help keep the fed on pause for longer than markets currently expect.
Against that backdrop, our investment outlook is anchored on three main themes. first. Stay invested in equities. We like dynamic factor strategies and keep a preference for large cap exposures over small caps. Second, follow the earnings. We continue leaning into the structural AI opportunity, where earnings growth is still running more than 40% year over year.
And look beyond the US. The semiconductor memory hardware and manufacturing ecosystem is global, and a very large share of that now sits in emerging markets. And finally, don't overlook diversification. Alternative strategies have continued to provide resilience during periods of equity weakness that makes them an increasingly valuable tool as markets navigate headlines.
Check out the full advisor outlook for more of our best thinking, and reach out to your local market team, or call 877. Ask one blk to dive deeper into any of those themes.
iCRDSPMH0726U/S-5736767
Worst-case stagflation risks have eased as Brent crude has fallen nearly 40% from April highs and Strait of Hormuz energy flows continue to normalize.
The U.S. economy has stayed resilient despite high inflation and hawkish Fed expectations, with labor rebounding and growth expected to hold momentum through 2026.
Rate expectations have moved higher, with futures pricing increased odds of a hike. Warsh’s first meeting skewed hawkish, but our base case remains a long pause.
To obtain more information on the fund(s) including the Morningstar time period ratings and standardized average annual total returns as of the most recent calendar quarter and current month end, please click on the fund tile. Past performance is not indicative of future results. The Morningstar RatingTM for funds, or "star rating", is calculated for managed products (including mutual funds, variable annuity and variable life subaccounts, exchange-traded funds, closed-end funds, and separate accounts) with at least a three-year history. Exchange-traded funds and open-ended mutual funds are considered a single population for comparative purposes. It is calculated based on a Morningstar Risk-Adjusted Return measure (excluding any applicable sales charges) that accounts for variation in a managed product's monthly excess performance, placing more emphasis on downward variations and rewarding consistent performance. The top 10% of products in each product category receive 5 stars, the next 22.5% receive 4 stars, the next 35% receive 3 stars, the next 22.5% receive 2 stars, and the bottom 10% receive 1 star. The Overall Morningstar Rating for a managed product is derived from a weighted average of the performance figures associated with its three-, five-, and 10-year 60-119 months of total returns, and 50% 10-year rating/30% five-year rating/20% three-year rating for 120 or more months of total returns. While the 10-year overall star rating formula seems to give the most weight to the 10-year period, the most recent three-year period actually has the greatest impact because it is included in all three rating periods.
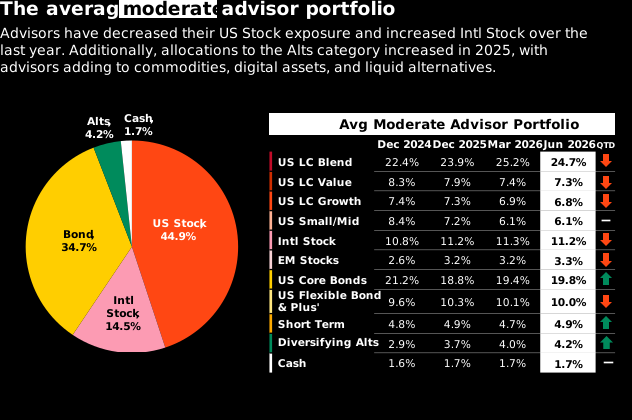
The average monthly portfolio asset class breakdown is constructed by the underlying holdings classification. Source: Morningstar, BlackRock, Aladdin. “Advisor models” data is as of 03/31/2026, based on the 961 “moderate” risk cohort models collected by BlackRock in the 3 months ending 03/31/2026. Advisor models collected by BlackRock are grouped into 5 risk cohorts for analysis, based on total equity allocation. Models in the “moderate” risk cohort are defined as any portfolio with an overall equity allocation of between 50-65%. BlackRock’s risk model data is supplemented by asset allocation and fund characteristic data from Morningstar. The portfolios analyzed represent a subset of the industry, and not its entirety. As such, there may be certain biases present in the data that reflect the advisors who choose to work with BlackRock to analyze their portfolios. The strategies discussed are strictly for illustrative and educational purposes and are not a recommendation, offer or solicitation to buy or sell any securities or to adopt any investment strategy. There is no guarantee that any strategies discussed will be effective.
Advisor allocations skew toward industrials, real estate, energy and utilities, balancing defensive and cyclical exposure amid elevated equity volatility.
Gold appears in 12% of portfolios, with an average allocation of ~3.5%, indicating selective use of commodities within the alternatives sleeve as part of broader diversification.
Within non U.S. equities, advisors show a preference for emerging markets, suggesting a targeted approach to accessing growth opportunities while maintaining a U.S. home bias.
Stay in the game with exclusive insights into market trends and strategies. BlackRock’s portfolio managers and product strategists offer valuable perspectives that may elevate your understanding of today’s market environment.
Stay informed with market recaps, actionable outlooks and timely webinars.
BlackRock’s Advisor Portfolio Insights analyze ~1,000 real advisor portfolios every quarter, examining asset allocation, risk and costs. Explore polling insights, key trends and identify potential areas for portfolio review in the Advisor Portfolio Insights Deck.
The Advisor Outlook is a monthly market resource for advisors. Each edition includes a short video from BlackRock strategists, 2–3 key market takeaways, advisor positioning insights and curated investments ideas aligned to that month's themes. It is designed to help advisors understand current market conditions and risks and opportunities for their clients.
The Advisor Outlook is built specifically for advisors. It is different because it:
The Advisor Outlook is designed primarily for advisor preparation, not direct client use. For client-ready content, use Student of the Market (downloadable and customizable slides built for sharing) or Investment Directions (triannual PDF). Use Advisor Outlook to inform your client conversations and see how other advisors are positioning for today’s markets.