Patterned tower

Advisor Outlook: Key market themes and risks

BlackRock’s Advisor Outlook provides financial professionals context on current market conditions, macro trends, and key investment topics across asset classes.

Key market trends

Digit 1

Midterm election spotlight

Historically, returns have improved once election uncertainty clears.
Digit 2

Strong fundamentals

Still-strong earnings growth supports our constructive equity outlook.
Digit 3

A divided Fed

Fed officials are navigating persistent inflation risks and softer labor market data.

Watch the November 2026 Advisor Outlook video

I'm Faye Witherall, an investment strategist here to discuss our November Advisor Outlook. Now, October was a sharp reminder of just how quickly market sentiment can shift. The Nasdaq 100 suffered its worst month of the year, and investors started to question the economics of the AI build out, even as Q3 corporate earnings continued to impress. So here's what we're watching.

Markets have historically rallied once election uncertainty passes, but shifting fiscal negotiations and growing scrutiny of data center developments introduce risks worth watching. The AI trade is under pressure, but the earnings are being strong. Demand continues to accelerate even amid concerns around AI financing.

And finally, higher yields are changing the diversification equation. Rising term premiums are pushing yields higher, while AI related borrowing is increasing the overlap between equity and credit risks. So we're looking through volatility. We are following the earnings and we're seeking diversification into year end.

Thanks, Faye, for setting the market backdrop. I'm Maxine and I'll walk through how advisors are positioning the diversified sleeves of their portfolios across alternatives and fixed income, starting with alternatives. Advisors are rethinking the sleeve. About 40% of advisor portfolios across conservative, moderate, and aggressive risk profiles hold alternatives, with an average allocation of roughly 9%. The bigger story, though, is the mix within that sleeve.

Between March and September, advisors rotated away from commodities and toward liquid alternatives. Liquid alts rose from about 56% to 65% of the sleeve. Commodities fell from about 39% to 30%. Clients still look to alternatives for diversification, but what they're gravitating toward is changing, and so is how advisors implement the sleeve.

Advisors access alternatives through active mutual funds 57% of the time, index ETFs 30% of the time, and active ETFs 13% of the time.

Turning to fixed income, the average duration across moderate portfolios is around 4.8 years, shorter than the roughly six years of the Bloomberg US Aggregate Index. Yet even with that short duration tilt already in place, duration is increasingly coming up in client conversations as a source of diversification to balance market volatility.

Check out the full Advisor outlook and Advisor Portfolio Insights for more of our best thinking, and reach out to your local market team, or call 877. Ask one BLC to dive deeper into any of these themes.

iCRDSPMH1126U/S-6085627

I'm Faye Witherall, an investment strategist here to discuss our November Advisor Outlook. Now, October was a sharp reminder of just how quickly market sentiment can shift. The Nasdaq 100 suffered its worst month of the year, and investors started to question the economics of the AI build out, even as Q3 corporate earnings continued to impress. So here's what we're watching.

Markets have historically rallied once election uncertainty passes, but shifting fiscal negotiations and growing scrutiny of data center developments introduce risks worth watching. The AI trade is under pressure, but the earnings are being strong. Demand continues to accelerate even amid concerns around AI financing.

And finally, higher yields are changing the diversification equation. Rising term premiums are pushing yields higher, while AI related borrowing is increasing the overlap between equity and credit risks. So we're looking through volatility. We are following the earnings and we're seeking diversification into year end.

Thanks, Faye, for setting the market backdrop. I'm Maxine and I'll walk through how advisors are positioning the diversified sleeves of their portfolios across alternatives and fixed income, starting with alternatives. Advisors are rethinking the sleeve. About 40% of advisor portfolios across conservative, moderate, and aggressive risk profiles hold alternatives, with an average allocation of roughly 9%. The bigger story, though, is the mix within that sleeve.

Between March and September, advisors rotated away from commodities and toward liquid alternatives. Liquid alts rose from about 56% to 65% of the sleeve. Commodities fell from about 39% to 30%. Clients still look to alternatives for diversification, but what they're gravitating toward is changing, and so is how advisors implement the sleeve.

Advisors access alternatives through active mutual funds 57% of the time, index ETFs 30% of the time, and active ETFs 13% of the time.

Turning to fixed income, the average duration across moderate portfolios is around 4.8 years, shorter than the roughly six years of the Bloomberg US Aggregate Index. Yet even with that short duration tilt already in place, duration is increasingly coming up in client conversations as a source of diversification to balance market volatility.

Check out the full Advisor outlook and Advisor Portfolio Insights for more of our best thinking, and reach out to your local market team, or call 877. Ask one BLC to dive deeper into any of these themes.

iCRDSPMH1126U/S-6085627

To obtain more information on the fund(s) including the Morningstar time period ratings and standardized average annual total returns as of the most recent calendar quarter and current month end, please click on the fund tile. Past performance is not indicative of future results. The Morningstar RatingTM for funds, or "star rating", is calculated for managed products (including mutual funds, variable annuity and variable life subaccounts, exchange-traded funds, closed-end funds, and separate accounts) with at least a three-year history. Exchange-traded funds and open-ended mutual funds are considered a single population for comparative purposes. It is calculated based on a Morningstar Risk-Adjusted Return measure (excluding any applicable sales charges) that accounts for variation in a managed product's monthly excess performance, placing more emphasis on downward variations and rewarding consistent performance. The top 10% of products in each product category receive 5 stars, the next 22.5% receive 4 stars, the next 35% receive 3 stars, the next 22.5% receive 2 stars, and the bottom 10% receive 1 star. The Overall Morningstar Rating for a managed product is derived from a weighted average of the performance figures associated with its three-, five-, and 10-year 60-119 months of total returns, and 50% 10-year rating/30% five-year rating/20% three-year rating for 120 or more months of total returns. While the 10-year overall star rating formula seems to give the most weight to the 10-year period, the most recent three-year period actually has the greatest impact because it is included in all three rating periods.

Explore advisor portfolio positioning in today’s markets

Advisor outlook Q326

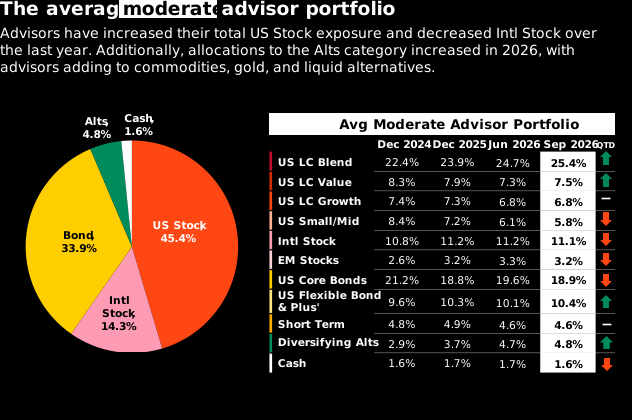
The average monthly portfolio asset class breakdown is constructed by the underlying holdings classification. Source: Morningstar, BlackRock, Aladdin. “Advisor models” data is as of 09/30/2026, based on the 982 “moderate” risk cohort models collected by BlackRock in the 3 months ending 09/30/2026. Advisor models collected by BlackRock are grouped into 5 risk cohorts for analysis, based on total equity allocation. Models in the “moderate” risk cohort are defined as any portfolio with an overall equity allocation of between 50-65%. BlackRock’s risk model data is supplemented by asset allocation and fund characteristic data from Morningstar. The portfolios analyzed represent a subset of the industry, and not its entirety. As such, there may be certain biases present in the data that reflect the advisors who choose to work with BlackRock to analyze their portfolios. See Important Notes slide for descriptions of each category.

Index ETFs drove equity sleeves; active funds led bonds and alts

77% of the equity sleeve was in ETFs, 56% in index ETFs. Active mutual funds made up 57% of alternatives, and active mutual funds and ETFs made up 61% of fixed income.

Alternatives have rotated out of commodities to liquid alts

40% of all FA models hold alternatives, averaging 9%, and liquid alts have grown from 56% to 65% of the sleeve as commodities slide to 30%.

Advisor equity sleeves leaned into value, away from quality

Against the benchmark, the average moderate FA has tilted towards value and dividend yield while running short on quality, growth and size, the exact reverse of the BLK Model's tilts.

Key market insights

Stay in the game with exclusive insights into market trends and strategies. BlackRock’s portfolio managers and product strategists offer valuable perspectives that may elevate your understanding of today’s market environment.

  • Model Portfolio

    Rebalancing act: adapting portfolios to changing markets

    May 28, 2026|ByBlackRock

    Model investment portfolio allocations created by BlackRock can help inform timely allocations and trades you make in your own portfolios.

  • Equity

    Equity Market Outlook

    What’s in store for Q4? Our outlook offers insight on investing in AI, balancing income and growth, and sourcing stock opportunities across the globe.

  • Fixed Income

    Fixed Income Outlook

    Similar yields can carry very different risks. Explore how investors can capture income while being deliberate about risk.

Frequently asked questions

  • BlackRock’s Advisor Portfolio Insights analyze ~1,000 real advisor portfolios every quarter, examining asset allocation, risk and costs. Explore polling insights, key trends and identify potential areas for portfolio review in the Advisor Portfolio Insights Deck.

  • The Advisor Outlook is a monthly market resource for advisors. Each edition includes a short video from BlackRock strategists, 2–3 key market takeaways, advisor positioning insights and curated investments ideas aligned to that month's themes. It is designed to help advisors understand current market conditions and risks and opportunities for their clients.

  • The Advisor Outlook is built specifically for advisors. It is different because it:

    • Updates monthly (vs. many quarterly outlooks)
    • Frames insights around client conversations
    • Connects themes to portfolio positioning and investment ideas
    • Is designed to be consumed in under 10 minutes
  • The Advisor Outlook is designed primarily for advisor preparation, not direct client use. For client-ready content, use Student of the Market (downloadable and customizable slides built for sharing) or Investment Directions (triannual PDF). Use Advisor Outlook to inform your client conversations and see how other advisors are positioning for today’s markets.