

CONTACT US
Additional questions?
Schedule a meeting with a BlackRock private credit specialist.
Private equity has become increasingly relevant to portfolio construction as the equity opportunity set has expanded well beyond public markets. Investors relying only on public equities may be missing a substantial portion of profitable businesses and potential long-term value creation. Private equity can help broaden a portfolio’s growth exposure through private company ownership, active management and manager-driven value creation. To learn more about what private equity is and how it works, see our Introduction to Private Equity.
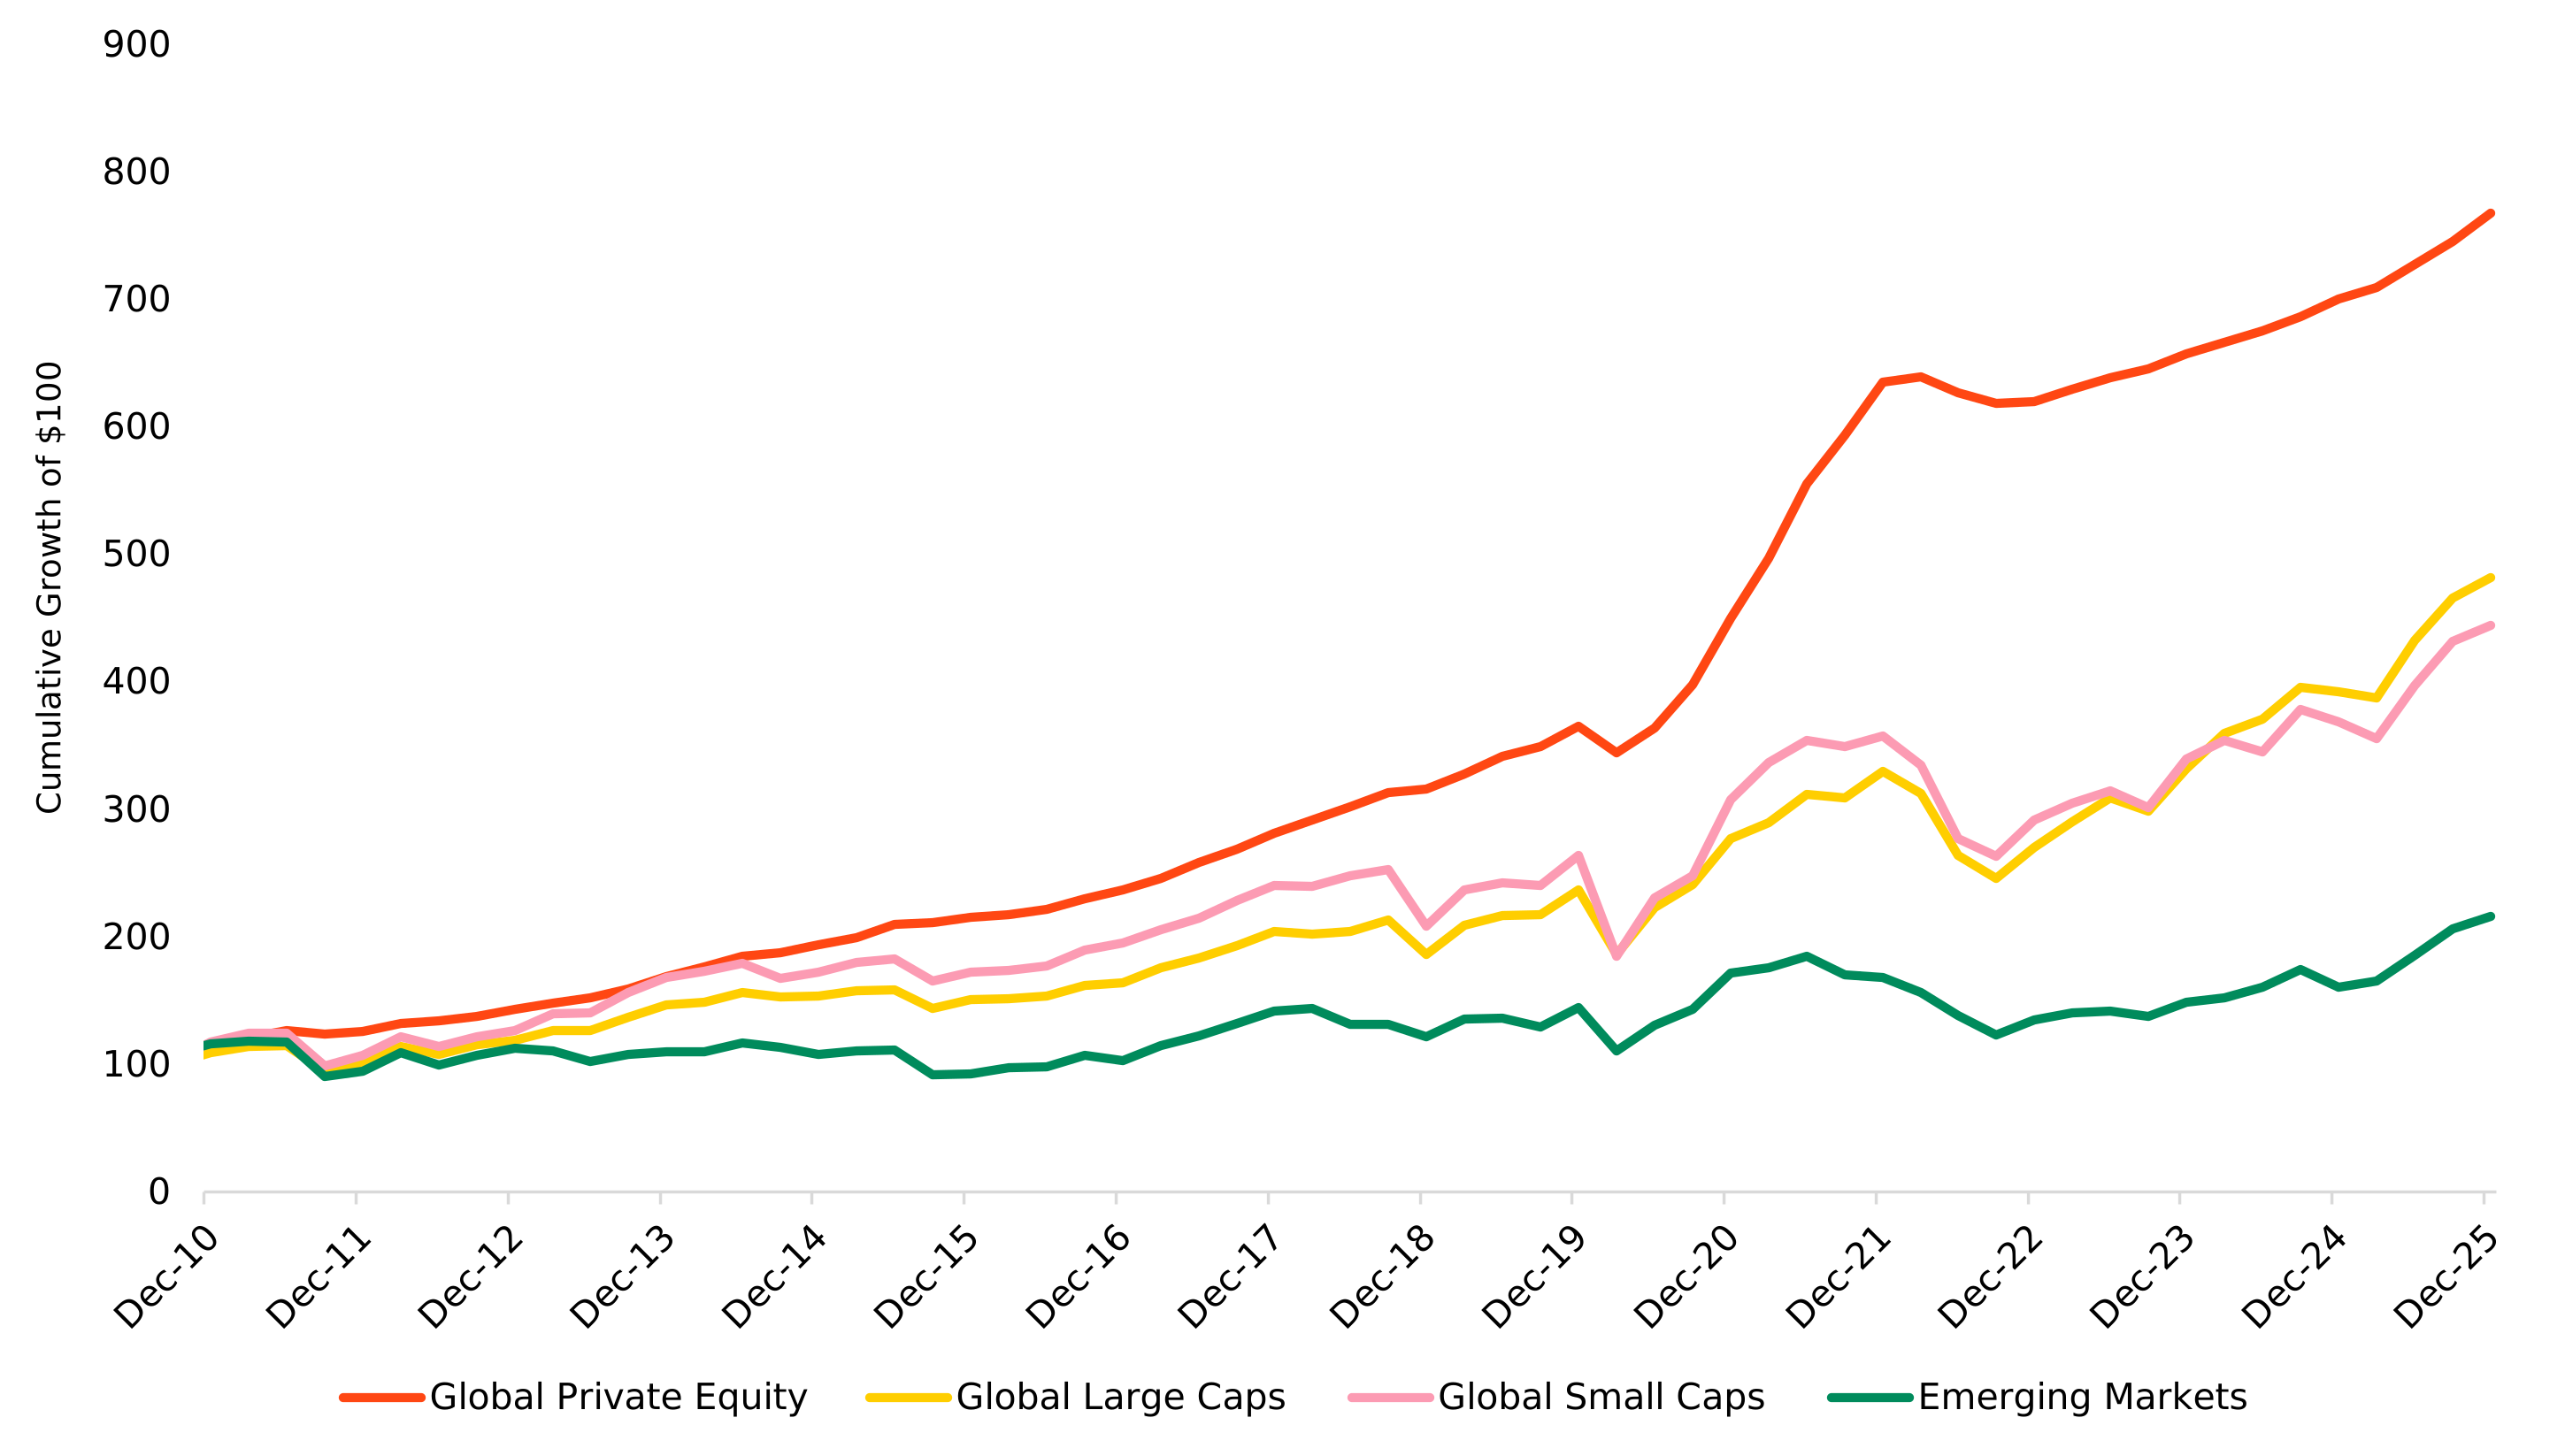
Based on the Preqin global private equity closed-end fund index, private equity has delivered competitive long-term cumulative performance relative to major public equity benchmarks, while offering exposure to companies and value creation pathways not fully represented in public indices.
Figure 1: Cumulative return of public equity versus private equity
Source: Preqin and BlackRock, with data from March 31, 2010, to Dec. 31, 2025. Global Private Equity represented by the Preqin Global Private Equity Closed-end Fund Index. Global Large Caps represented by the MSCI ACWI Total Return Index, Global Small Caps represented by the MSCI World Small Cap Total Return Index, Emerging Markets represented by the MSCI Emerging Markets Total Return Index. Past performance is not indicative of current or future results. Indexes shown for illustrative purposes only. It is not possible to invest directly in an index.
Private equity is a multi-strategy market with different investment approaches, company stages, return drivers, risk profiles and implementation considerations. Understanding these differences is important because a private equity allocation can look very different depending on whether it is focused on buyouts, venture capital, growth equity, secondaries or fund-of-funds and others.
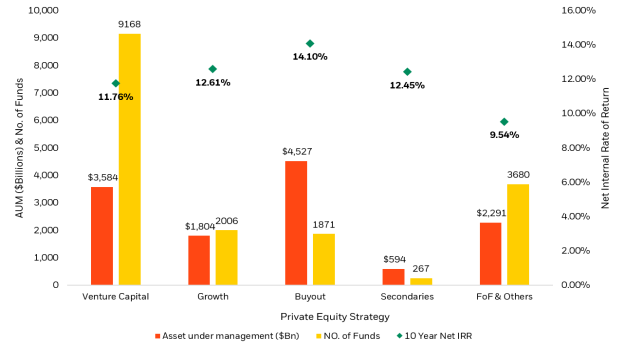
The return profile varies across strategies, with 10-year annualized returns ranging from 11-14%, as shown in Figure 2. For investors, the key question is not simply whether to allocate to private equity, but which private equity strategies best align with their return objectives, risk tolerance, liquidity needs and total portfolio goals. Buyout is often used as a core private equity allocation because it focuses on more mature companies and operational value creation. Venture capital and growth equity can provide access to innovation and company expansion, but they often come with higher dispersion and longer realization periods. Secondaries may help provide more seasoned exposure, while fund-of-funds can offer diversified access across managers and vintages. Meanwhile, manager selection matters more because dispersion across managers is much wider in private equity than in public markets.
Diversification across these factors can help build a more resilient portfolio. The objective is not just to access the asset class, but to build a portfolio that can perform through different market environments.
Figure 2: Private equity market breakdown by strategy
Source: Preqin and BlackRock, with data as of Sep. 30, 2025. Venture Capital: Preqin Global venture capital funds including start-ups and seeds; Growth: Preqin global growth funds; Buyout: Preqin global buyout funds; Secondaries: Preqin global secondaries funds; FoF & Others: Preqin global fund of funds including co-investment, multi-manager and hybrid funds.
In portfolio construction, private equity should be treated as an extension of equity risk, not a diversifier that is fully independent from public equity markets. Like public equity, private equity is exposed to company fundamentals, earnings growth, valuation cycles and economic conditions. Unlike public equity, returns are shaped more directly by active ownership, operational improvement, manager selection, capital structure decisions and the timing of exits and distributions.
Liquidity is a key consideration when adding private equity to a portfolio. Because private equity cash flows are delayed and typically uneven, these allocations should be funded from capital that can tolerate these constraints. Investors should also maintain sufficient liquid assets to meet capital calls, rebalance the broader portfolio and continue making commitments across market cycles, including periods when distributions slow.
Although private equity shares common risk drivers with public equity, it can still improve whole-portfolio construction through its differentiated return sources and interaction with broader asset classes. Its diversification benefit comes not from being fully independent of equity risk, but from broadening the portfolio’s growth exposure beyond public markets.
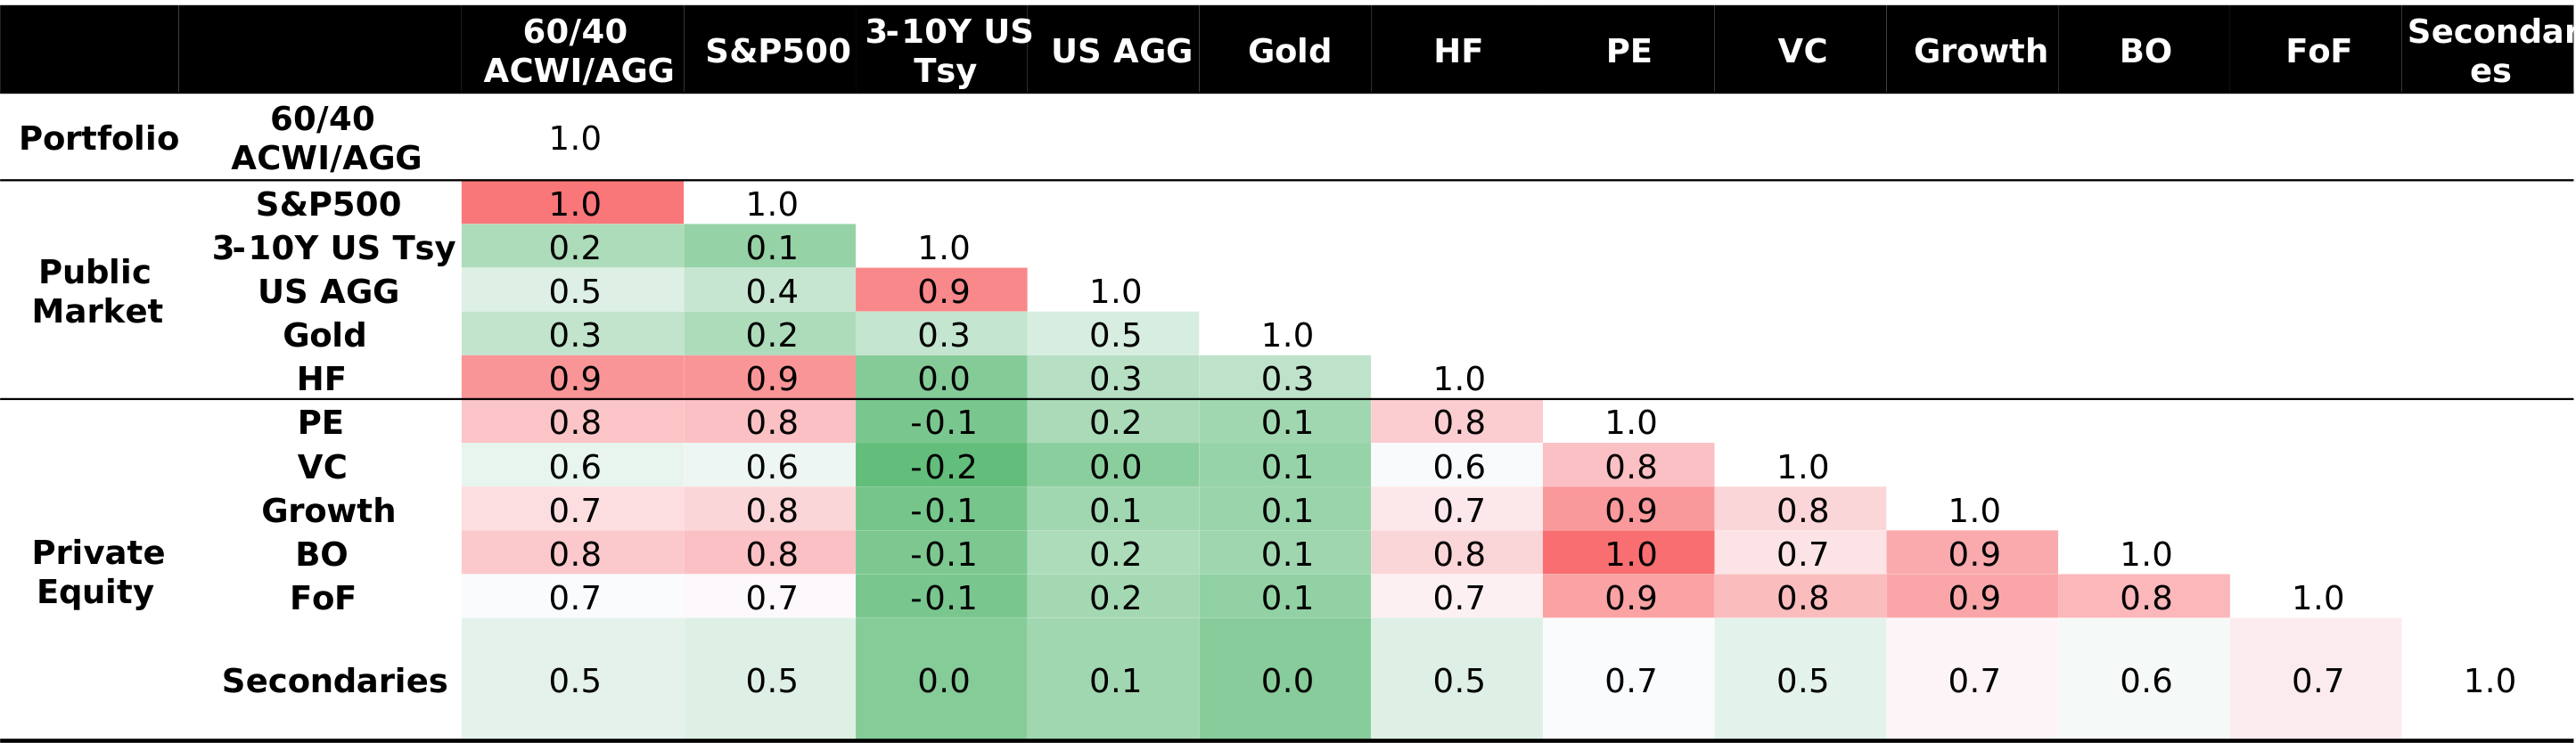
As shown in Figure 3, private equity strategies remain connected to equity risk (0.8 correlation between private equity and the S&P 500 and a traditional 60/40 portfolio). However, private equity has low correlations to traditional diversifiers such as U.S. Treasuries, the U.S. Aggregate Bond Index and gold. These lower correlations underscore the importance of considering private equity an extension of public equity, which can reduce the overall portfolio risk. The asset class is a growth allocation that can broaden the sources of equity-like returns while interacting differently with defensive assets.
Figure 3: Correlation matrix
Source: Preqin and BlackRock, analysis period from Jan. 1, 2010 to Dec. 31, 2025 and with quarterly frequency. 60/40 ACWI/AGG: 60% MSCI ACWI Index /40% Bloomberg US Aggregate Bond Index. S&P500: S&P 500 Index, 3-10Y US Tsy: Bloomberg US Treasury 3-10 years total return index. US AGG: Bloomberg US Aggregate Bond Index; Gold: S&P Global Gold Index. HF: HFRI Hedge Fund Diversity Index. PE Index: Preqin Global Private Equity Closed-End Fund Index; Venture Capital/VC: Preqin Global Venture Capital Closed-End Fund Index; Growth: Preqin Global Growth Closed-End Fund Index; Buyout/BO: Preqin Global Buyout Closed-End Fund Index; Fund-of-Funds/FoF & Others: Preqin Global Fund of Funds Closed-End Fund Index; Secondaries: Preqin Global Secondaries Closed-End Fund Index; Preqin Index return data are de-smoothed by BlackRock for private markets using the Geltner Technique.
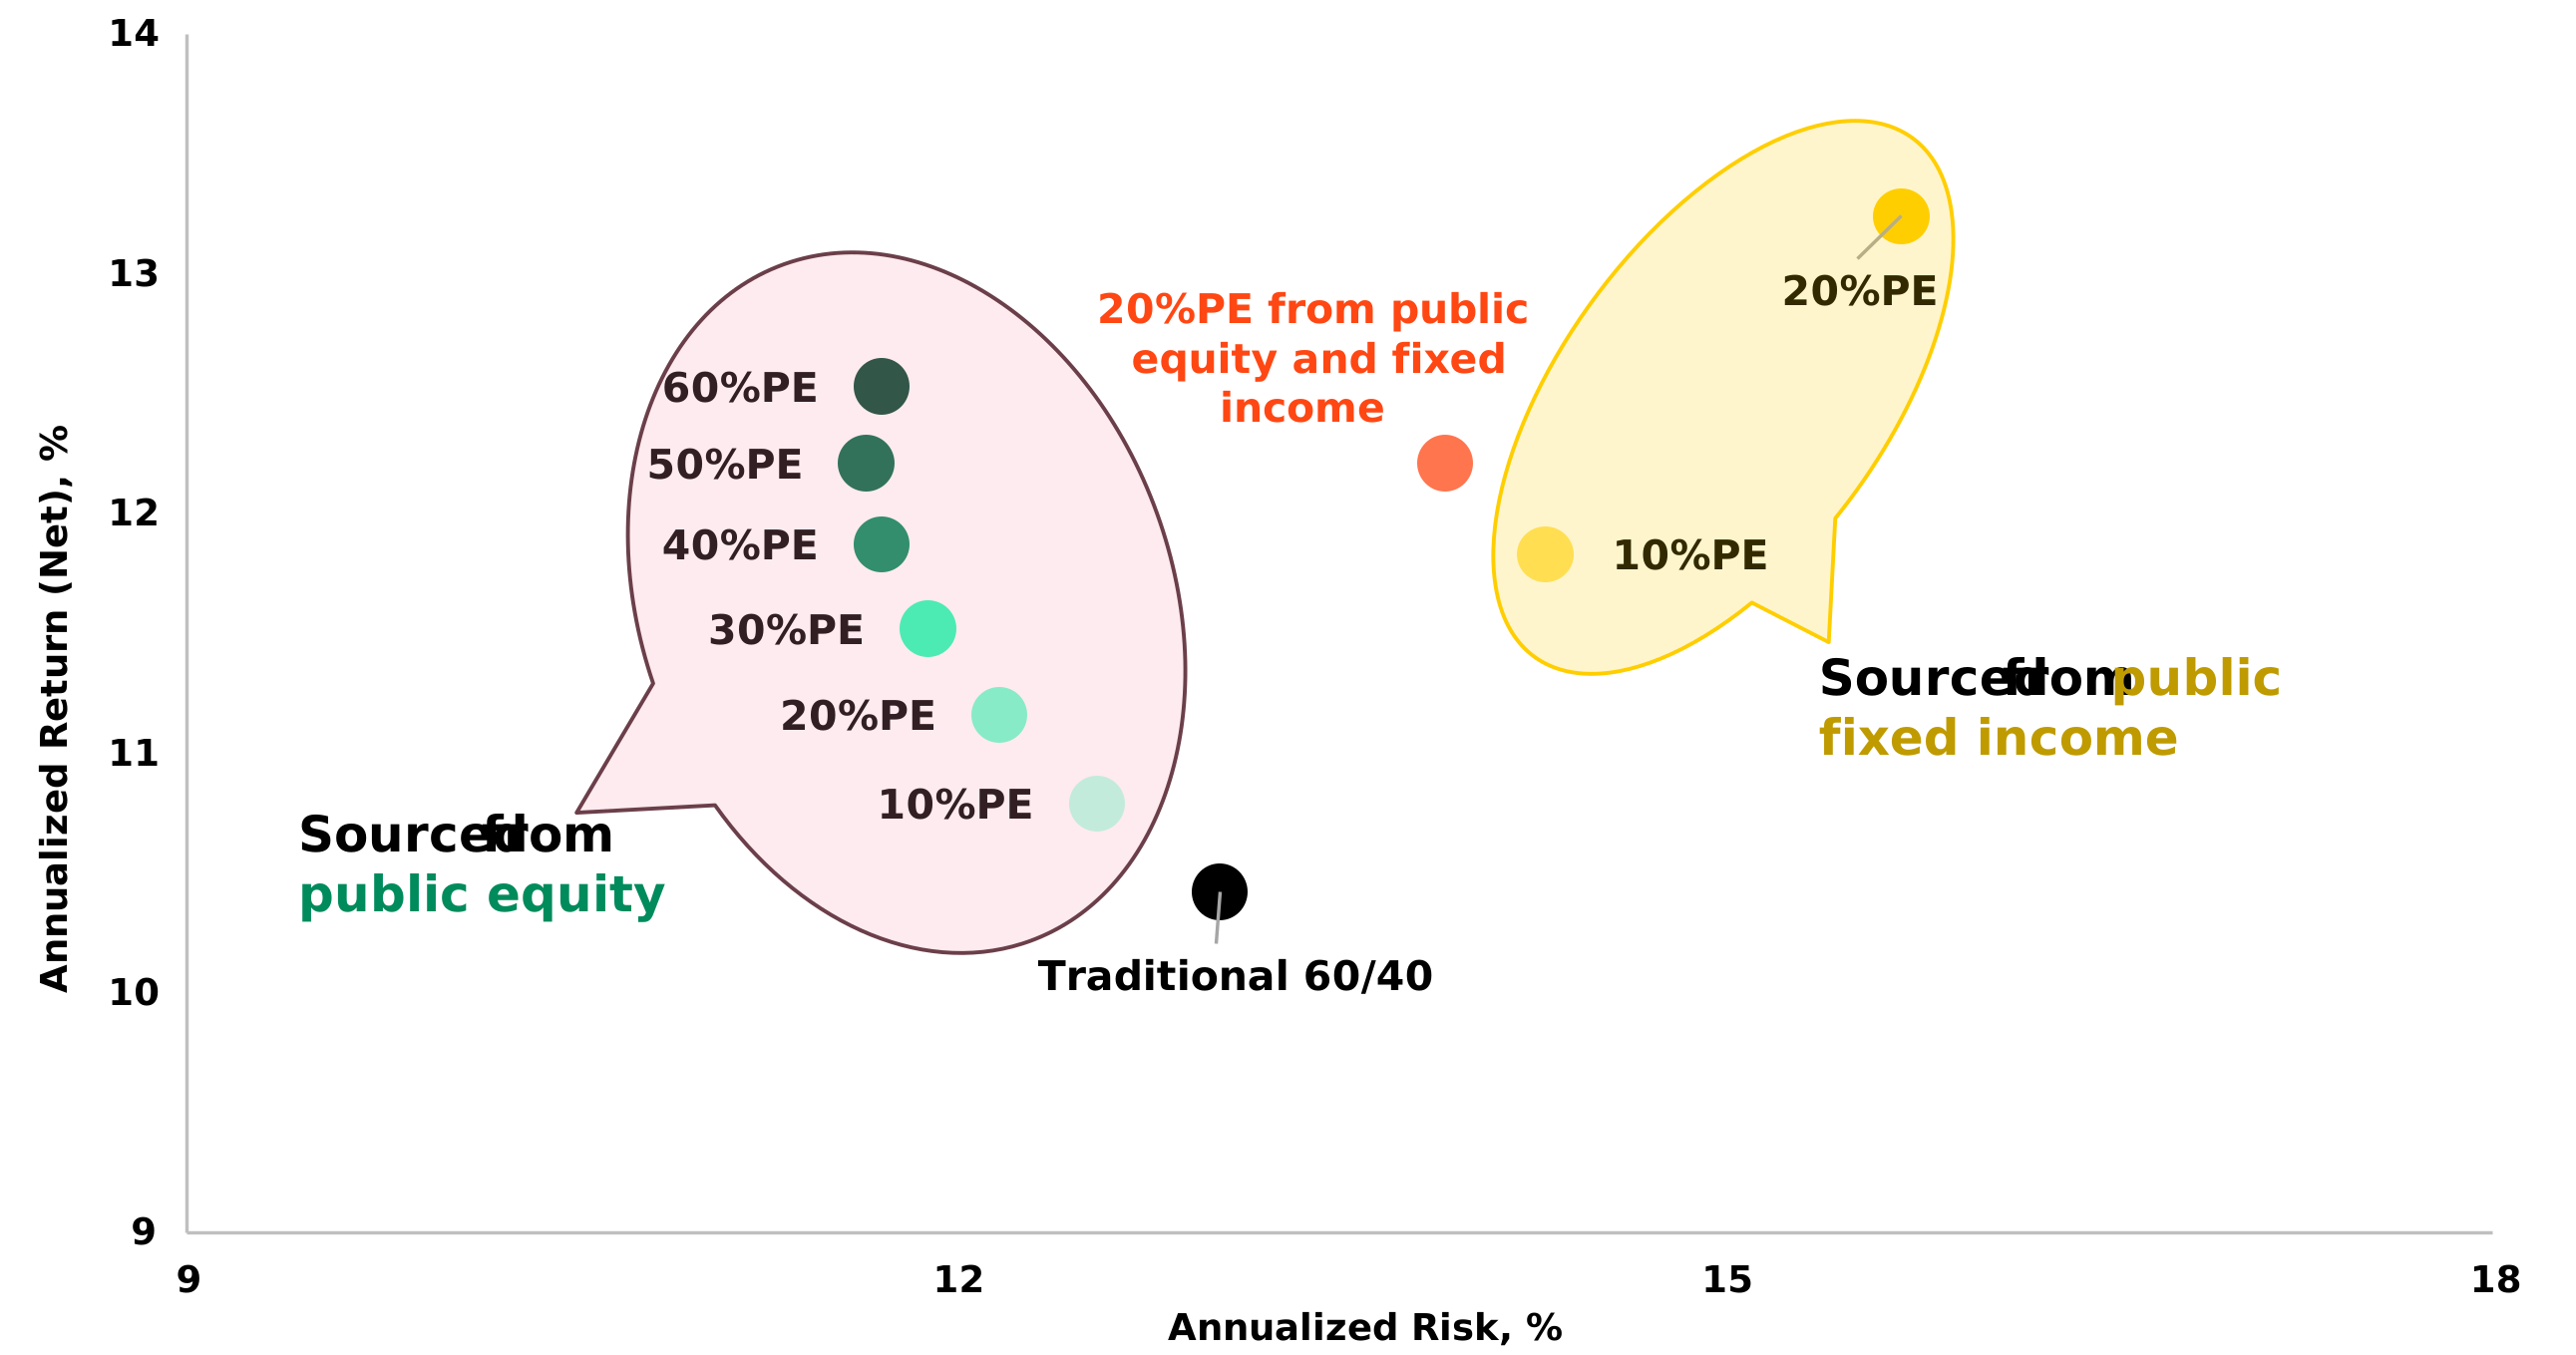
Traditional portfolios (60% public equity/40% fixed income) have become less efficient as public fixed income has provided less reliable hedging power against public equity risk. Including private equity can improve portfolio efficiency by introducing additional return premium and potential diversification beyond public markets. The appropriate allocation should be identified by solving for the investor’s objective for their whole portfolio, such as higher return, lower risk, lower tracking error or maximum Sharpe ratio, while considering liquidity needs and implementation constraints.
Figure 4: Hypothetical portfolio construction with private equity
Source: Preqin and BlackRock, analysis period from Jan. 1, 2010 to Dec. 31, 2025 with quarterly frequency. Traditional 60/40: 60% MSCI ACWI Index / 40% Bloomberg U.S. Aggregate Bond Index. PE: Preqin Global Private Equity Closed-end Fund Index. 10% PE-60%PE sourced from public equity: Portfolios with 40% Bloomberg U.S. Aggregate Bond Index and reallocating 10% to 60% from MSCI ACWI Index to Preqin Global Private Equity Closed-end Fund Index. High PE allocations are shown for sensitivity analysis and may not be suitable for many investors given their liquidity, pacing, governance and concentration constraints; 10%PE-20%PE sourced from public fixed income: Portfolios with 60% MSCI ACWI Index and reallocating 10% and 20% from Bloomberg U.S. Aggregate Bond Index to Preqin Global Private Equity Closed-end Fund Index; 20% PE from public equity and fixed income: 50% MSCI ACWI Index/30% Bloomberg U.S. Aggregate Bond Index /20% Preqin Global Private Equity Closed-end Fund Index. Preqin Index return data are de-smoothed by BlackRock for private markets using the Geltner technique. Index performance is for illustrative purposes only. Indexes are unmanaged and one cannot invest directly in an index. Past performance does not guarantee future results. Hypothetical performance is for illustrative purposes only. It does not represent real performance and often benefits from hindsight. Since trades were not executed, it cannot reflect market risks like interest rate changes or lack of liquidity, nor does it include trading costs. Many factors affecting actual results cannot be accounted for in hypothetical data, and can adversely affect actual results.
We illustrate a building-block approach to incorporating private equity into a portfolio that uses buyout for core exposure, growth and venture for innovation and expansion, secondaries for seasoning and liquidity management and fund-of-funds for access and diversification when direct manager selection is constrained.
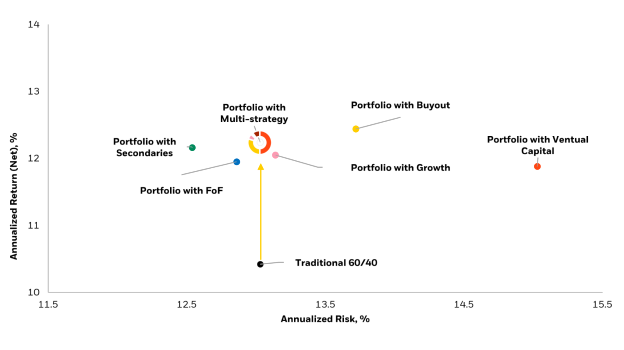
As shown in Figure 5, our analysis suggests that reallocation from a traditional 60/40 portfolio to a hypothetical 50/30/20 portfolio that includes any private equity strategy would have increased total returns. Other findings:
Figure 5: Hypothetical portfolios’ return and risk comparison
Source: Preqin and BlackRock, analysis period from Jan. 1, 2010, to Dec. 31, 2025, with quarterly frequency. Traditional 60/40: 60% MSCI ACWI Index / 40% Bloomberg U.S. Aggregate Bond Index. Portfolio with venture capital, Portfolio with growth, Portfolio with buyout:, Portfolio with secondaries, Portfolio with fund of funds: The allocation of these four portfolios are the 50% MSCI ACWI Index/30% Bloomberg U.S. Aggregate Bond Index/20% of each corresponding Preqin Private Equity Closed-End Fund Indices by different strategy. Portfolio with Multi-strategy: 50% MSCI ACWI Index/30% Bloomberg U.S. Aggregate Bond Index/7% Preqin Private Buyout Closed-End Fund Index/1% Preqin Private Growth Closed-End Fund Index/1% Preqin Private Venture Capital Closed-End Fund Index/1% Preqin Private Fund-of-Fund Closed-End Fund Index/10% Preqin Private Secondaries Closed-End Fund Index. Preqin Index return data are de-smoothed by BlackRock for private markets using the Geltner technique. Index performance is for illustrative purposes only. Indexes are unmanaged and one cannot invest directly in an index. Past performance does not guarantee future results. Hypothetical performance is for illustrative purposes only. It does not represent real performance and often benefits from hindsight. Since trades were not executed, it cannot reflect market risks like interest rate changes or lack of liquidity, nor does it include trading costs. Many factors affecting actual results cannot be accounted for in hypothetical data, and can adversely affect actual results.
Private equity can play an important role in portfolio construction by expanding equity exposure beyond listed markets and providing access to differentiated sources of long-term value creation. However, the asset class should be evaluated with appropriate context: Private equity is not a single strategy; performance should be assessed using multiple metrics, and implementation requires careful consideration of liquidity, diversification, manager selection and time horizon.
For suitable investors, the key question is not simply whether to include private equity, but how to size, fund, diversify and monitor the allocation within a total portfolio. When implemented thoughtfully, private equity can serve as a durable complement to public markets and a meaningful component of a modern growth allocation.
Schedule a meeting with a BlackRock private credit specialist.
1. De-smoothing: Private assets’ valuation is reported less frequently than public markets, reported volatility and correlations may appear smoother than the true economic risk. De-smoothing is used to make private market risk more comparable with public market assets.
This material is intended for information purposes only, and does not constitute investment advice, a recommendation or an offer or solicitation to purchase or sell any securities to any person in any jurisdiction in which an offer, solicitation, purchase or sale would be unlawful under the securities laws of such jurisdiction. This material may contain estimates and forward-looking statements, which may include forecasts and do not represent a guarantee of future performance. This information is not intended to be complete or exhaustive and no representations or warranties, either express or implied, are made regarding the accuracy or completeness of the information contained herein. The opinions expressed are as of September 2026 and are subject to change without notice. Reliance upon information in this material is at the sole discretion of the reader.
Investing involves risk, including possible loss of principal. This material is strictly for illustrative, educational, or informational purposes and is subject to change. There can be no assurance that an investment strategy based will be successful.
Past performance is no guarantee of future results. It is not possible to invest in an unmanaged index. Diversification does not ensure profits or protect against loss.
Incorporating alternative investments into a portfolio presents the opportunity for significant losses including in some cases, losses which exceed the principal amount invested. Also, some alternative investments have experienced periods of extreme volatility and in general, are not suitable for all investors. Asset allocation and diversification strategies do not ensure profit or protect against loss in declining markets.
Private market investments should only be considered for investors who can tolerate the risk. A fund’s investments in private companies are subject to a number of risks. Private companies are generally not subject to SEC reporting requirements, are not required to maintain their accounting records in accordance with generally accepted accounting principles and are not required to maintain effective internal controls over financial reporting. As a result, the Sub Advisor may not have timely or accurate information about the business, financial condition and results of operations of the private companies in which the Fund invests.
© 2026 BlackRock, Inc. or its affiliates. All Rights Reserved. BLACKROCK is a trademark of BlackRock, Inc. or its affiliates. All other trademarks are those of their respective owners.
Prepared by BlackRock Investments, LLC.
GPS0926-H-5773051-EXP0927