

Tax

Oct 09, 2026
Market cap-weighted indexes have been a high hurdle for active managers. From an after-tax lens perspective, capital gains distributions may create a second hurdle, as advisors seek to not only find alpha but help investors keep more of it. Wider dispersion within equities may be expanding the opportunity to clear both, and for active strategies delivered in a pooled vehicle, the wrapper may matter as much as the strategy.
Key Takeaways
- Market cap-weighted indexes have been a difficult hurdle for active managers, particularly when market leadership has been concentrated in the largest stocks.
- For taxable investors, the index hurdle is higher still, as capital gains distributions may reduce after-tax returns.
- Wider stock-level dispersion can create a richer opportunity set for active security selection and may also offer tax-loss harvesting opportunities.
- Structure matters: over the past five years, active ETFs have generally been more tax efficient than their mutual fund counterparts.1
- Active ETFs like DYNF and THRO show what's possible. Both ETFs have outperformed more than 90% of large blend funds over the past three years on an after-tax basis.
- The after-tax toolkit can extend beyond active ETFs, with ETFs like TOPT and QTOP helping investors broaden concentrated mega-cap exposure while SMAs can offer more customized, year-round tax management.
The uncomfortable truth for active: indexing is a high hurdle
Indexing has earned its place in portfolios. In a market where performance has been heavily influenced by a small group of mega-cap leaders, broad market-cap-weighted exposure has been difficult to beat. Through August 2026, the iShares Core S&P 500 ETF, IVV, outperformed 81% of large blend funds over the past five years, ranked against 1127 funds.2 This is the first hurdle actively managed strategies come up against - before considering taxes, indexes themselves have been unusually strong competitors.
Taxes can reduce already hard-to-find alpha
Even when active managers outperform cap weighted indices, taxable investors may not receive the full benefit. Capital gains distributions can erode returns, stacking a second hurdle on top of the first. Over the past year, the tax drag for large blend funds has been nearly 2%.3
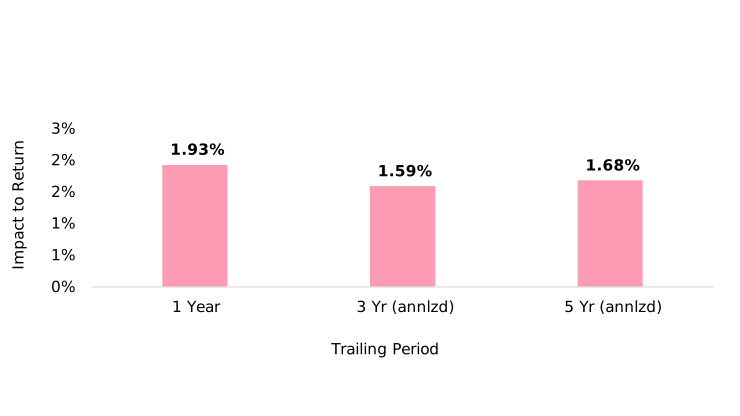
Source: Morningstar, as of August 31 2026. Based on annualized pre-tax and post-tax pre-liquidation returns over the 1-, 3- and 5-year periods for Morningstar’s U.S. Large Blend category.
Dispersion has created an opportunity
Headline numbers for index performance can look strong even when the experience beneath the surface is far more uneven. Despite the S&P 500 returning 13% YTD through August, 38% of stocks within the index are in the red, with 115 stocks down more than 10%.
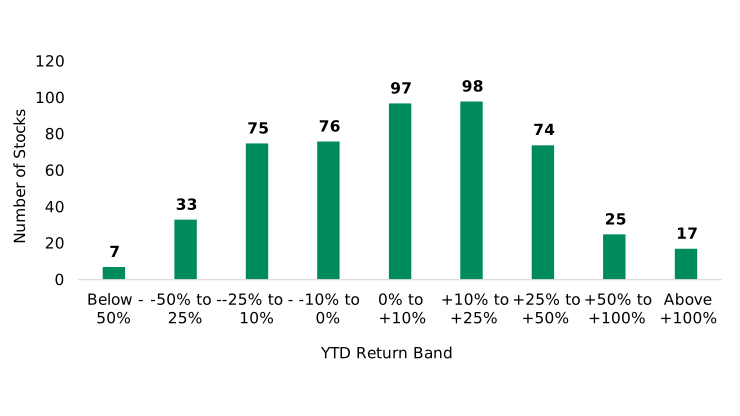
Source: Morningstar, as of August 31 2026. Distribution of S&P 500 constituent YTD returns, calculated by grouping individual stock returns into the return ranges shown. Each bar represents the number of stocks within the respective return range, collateral and futures carry no return and are excluded.
This type of dispersion can make the opportunity set more dynamic and create more room for active managers to add value through security selection.
ETFs may reduce potential tax drag
Two managers running similar strategies may deliver meaningfully different after-tax outcomes depending on the wrapper utilized. Over the past five years, active ETFs have generally exhibited more tax efficiency when compared to their mutual fund counterparts.
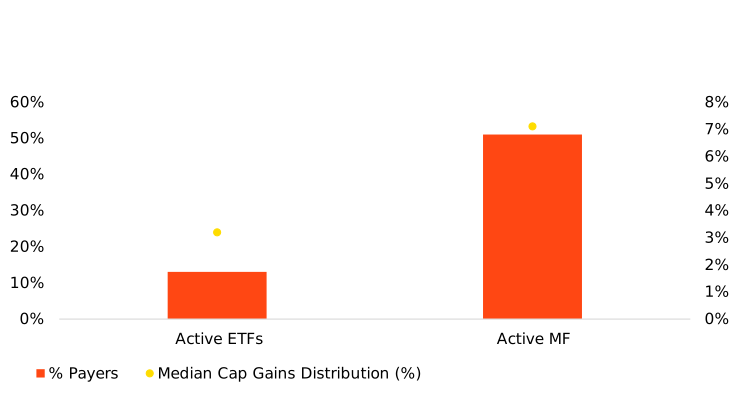
Source: Morningstar Direct, as of 31 December 2025. Avg % of payers = avg % of funds that have paid out cap gains in each year from 2021-2025. Median cap gain distribution as a % of NAV = median cap gain distribution from 2021-2025. Analysis includes U.S. mutual funds and U.S.-listed ETFs with available NAVs as of 30 November 2025 in each applicable year. Mutual fund universe includes only oldest share class funds. Past distribution not indicative of future distributions.
Put simply, the wrapper doesn't generate alpha — but it can influence how much of it is kept by an investor.
|
Active MF |
Active ETF |
|
Potential alpha Capital gains distributions often create additional hurdles |
Potential alpha ETF architecture may help reduce capital gains distributions |
All regulated investment companies, including ETFs, are obliged to distribute portfolio gains to shareholders by year-end. Trading shares of ETFs may also generate tax consequences and transaction expenses. Certain traditional mutual funds can also be tax efficient.
Active ETFs that have cleared the index hurdle
Investors may have defaulted to S&P 500 ETFs like IVV for large blend exposure precisely because the index has been so hard to beat when combined with the potential for greater tax efficiency of the ETF wrapper as compared to a traditional mutual fund. But if the bar has been set there, there are some active ETFs that still stand out.
Over the past three years, IVV outperformed 78% of large blend funds on an after-tax basis.4 Over that same period, the iShares U.S. Equity Factor Rotation Active ETF (DYNF) and the iShares U.S. Thematic Rotation Active ETF (THRO) each outperformed more than 90% of large blend funds on an after-tax basis. While THRO's track record does not yet span five years, DYNF's does — and on an after-tax basis, it has outperformed 97% of the category over that period.
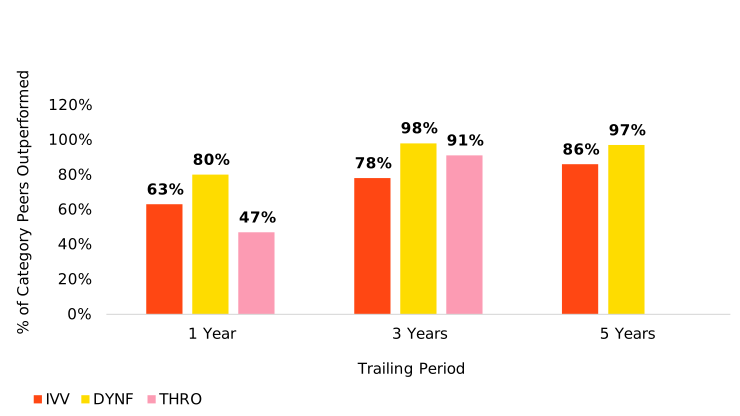
Source: Morningstar, as of August 31, 2026. Data reflects the percentage of funds in Morningstar’s U.S. Large Blend category that have been outperformed over the 1-, 3- and 5-year periods based on after-tax returns. The Morningstar U.S. Large Blend category consisted of 1,322 funds for the 1-year period, 1,211 funds for the 3-year period and 1,127 funds for the 5-year period. After-tax returns are pre-liquidation and assume the highest federal marginal tax rates in effect at the time of each distribution; they do not reflect state or local taxes, or the impact of taxes on the sale of fund shares. Percentage of peer funds outperformed is calculated as 100% minus each fund’s respective Morningstar category rank for the period shown. Peer rankings are relative to the applicable Morningstar category universe and may change over time. Past performance does not guarantee future results.
Percentile rankings tell part of the story. On an after-tax return basis, both funds also outpaced IVV over the trailing three-year period.
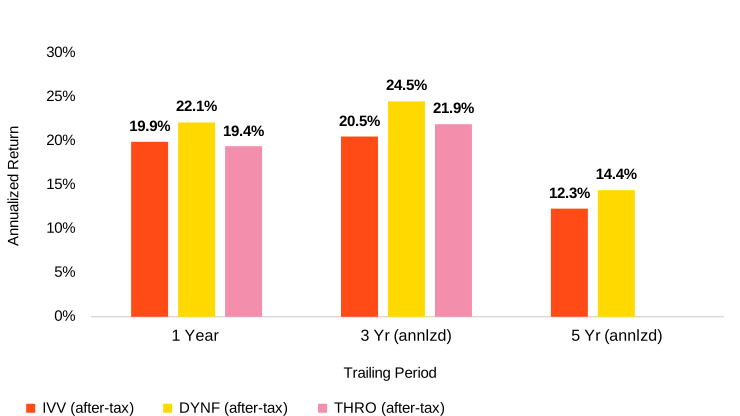
Source: Morningstar Direct, as of August 31 2026. After-tax returns are pre-liquidation and assume the highest federal marginal tax rates in effect at the time of each distribution; they do not reflect state or local taxes, or the impact of taxes on the sale of fund shares. Data is based on post-tax pre-liquidation annualized returns over a 1-, 3- and 5-annualized returns period for Morningstar’s U.S. Large Blend category.
Performance data represents past performance and does not guarantee future results. Investment return and principal value will fluctuate with market conditions and may be lower or higher when you sell your shares. Current performance may differ from the performance shown. For most recent month-end performance and standardized performance, click the following tickers: IVV, DYNF, THRO.
Extending the after-tax toolkit beyond active ETFs
The same stock-level volatility that can create opportunities for active security selection may also create tax-loss harvesting opportunities for investors. This is particularly relevant today, as many portfolios have become increasingly concentrated in a handful of mega-cap stocks and several of those stocks are down more than 15% YTD.⁵ For investors who own those stocks directly, the recent pullback may create opportunities to harvest losses while remaining aligned with their broader investment objectives.
That’s where TOPT and QTOP can fit. TOPT owns the top 20 stocks in the S&P 500, while QTOP owns the top 30 stocks in the Nasdaq-100. Rather than transitioning from a single stock into a broad market-cap-weighted allocation, investors can use these ETFs to broaden single-stock concentration into a basket of mega-cap leaders.
Importantly, TOPT and QTOP are not active ETFs — they are index ETFs. The point here isn't about alpha; it's that the ETF structure itself can help investors make more intentional transitions in taxable portfolios, moving from concentrated single-stock risk to more precise exposures while staying aligned with the portfolio view.
For clients who need more customization, SMA solutions can extend the tax-aware lens further. Direct indexing through tax-managed SMAs gives investors ownership of individual securities, providing greater flexibility to personalize exposures, tailor portfolios to individual preferences and manage portfolio transitions in a tax-aware manner. This more customized approach can complement the benefits offered by the ETF wrapper.
In today’s environment, it’s important to focus not just on finding alpha, but also on understanding how taxes may affect investment outcomes. Investors should consider the tax implications of their investment decisions in consultation with their tax advisors when constructing and managing portfolios. Explore the full suite of after-tax solutions offered by BlackRock here.

Daniel Bush, CFA
Senior iShares Product Consultant
Daniel Bush, CFA, is a senior member of the iShares Product Consulting team within BlackRock’s Global Product Solutions business. He is responsible for delivering deep investment and product expertise across the full iShares platform to clients spanning wealth, institutional, and end-investors.
Performance data represents past performance and does not guarantee future results. Investment return and principal value will fluctuate with market conditions and may be lower or higher when you sell your shares. Current performance may differ from the performance shown. For most recent month-end performance see www.iShares.com. For standardized performance and more information on Morningstar Ratings, including other time periods covered, click on fund cards above.
The Morningstar RatingTM for funds, or "star rating", is calculated for managed products (including mutual funds, variable annuity and variable life subaccounts, exchange-traded funds, closed-end funds, and separate accounts) with at least a three-year history. Exchange-traded funds and open-ended mutual funds are considered a single population for comparative purposes. It is calculated based on a Morningstar Risk-Adjusted Return measure (excluding any applicable sales charges) that accounts for variation in a managed product's monthly excess performance, placing more emphasis on downward variations and rewarding consistent performance. The top 10% of products in each product category receive 5 stars, the next 22.5% receive 4 stars, the next 35% receive 3 stars, the next 22.5% receive 2 stars, and the bottom 10% receive 1 star. The Overall Morningstar Rating for a managed product is derived from a weighted average of the performance figures associated with its three-, five-, and 10-year (if applicable) Morningstar Rating metrics. The weights are: 100% three-year rating for 36-59 months of total returns, 60% five-year rating/40% three-year rating for 60-119 months of total returns, and 50% 10-year rating/30% five-year rating/20% three-year rating for 120 or more months of total returns. While the 10-year overall star rating formula seems to give the most weight to the 10-year period, the most recent three-year period actually has the greatest impact because it is included in all three rating periods.
More articles loaded. Use Shift+Tab keys to browse.
Total articles:


FAQ:
-
Many investors focus on pre-tax returns, but taxes can have a meaningful impact on what clients ultimately keep. For example, in taxable accounts, capital gains distributions may reduce after-tax outcomes, making it important to evaluate both performance and the potential for greater tax efficiency.
-
Dispersion refers to the difference in performance between individual stocks. When performance varies widely across companies, active managers may have greater opportunities to add value through security selection. Higher dispersion may also create more opportunities for tax-loss harvesting.
-
The ETF structure can help improve after-tax outcomes by reducing the likelihood that the fund distributes taxable capital gains to shareholders, as compared to their traditional mutual fund counterparts. This may help allow investors to retain more of their investment returns.
-
Many investors use broad market ETFs like IVV because of their strong performance and the potential for greater tax efficiency than their mutual fund counterparts. DYNF and THRO demonstrate that some active ETFs have been able to compete with that hurdle, delivering strong relative after-tax results versus both peers and broad market benchmarks.
-
Investors with significant single-stock exposure may be able to use tools such as TOPT, QTOP and tax-managed SMA solutions to diversify positions, broaden exposure beyond a single holding and manage portfolio transitions, remaining aligned with their broader investment views, while also considering tax-aware implementation strategies where appropriate.
Investments
Insights
Retirement
Tools
Resources
About Us


1. Over the last five years, only 13% of Active ETFs have made capital gains distributions versus 51% of active mutual funds and 50% of index mutual funds. Source: BlackRock analysis of Morningstar data as of December 31 2025. Past distributions not indicative of future distributions.
2. Source: Morningstar, as of August 31 2026. Comparison universe is ETFs and mutual funds in the U.S. Open-End Large Blend Morningstar Category and based on total return. IVV ranked 345 out of 1322 funds for the 1-year period and 111 out of 894 funds for the 10-year period. Past performance does not guarantee future results.
3. Source: BlackRock, Morningstar as of August 31 2026. Tax drag is calculated as the difference between a fund’s pre-tax return and its Morningstar post-tax pre-liquidation return over the same period. Post-tax pre-liquidation returns reflect the impact of taxes on fund distributions, assuming investors are subject to the highest federal marginal tax rates and reinvest after-tax distributions. The calculation assumes the investment is held, rather than sold, at the end of the measurement period and therefore does not reflect any taxes that may be incurred upon liquidation. State and local taxes are not included.
4. Source: Morningstar, as of August 31 2026. Data is based on post-tax pre-liquidation annualized returns over a 3-year period for Morningstar’s U.S. Large Blend category.
5. Source: Morningstar, as of August 31, 2026. Figure based on YTD cumulative returns.
Important Information
Carefully consider the Funds' investment objectives, risk factors, and charges and expenses before investing. This and other information can be found in the Funds' prospectuses or, if available, the summary prospectuses which may be obtained by visiting www.iShares.com or www.blackrock.com. Read the prospectus carefully before investing.
Investing involves risk, including possible loss of principal.
There can be no assurance that performance will be enhanced or risk will be reduced for funds that seek to provide exposure to certain quantitative investment characteristics ("factors"). Exposure to such investment factors may detract from performance in some market environments, perhaps for extended periods. In such circumstances, a fund may seek to maintain exposure to the targeted investment factors and not adjust to target different factors, which could result in losses.
Funds that concentrate investments in specific industries, sectors, markets or asset classes may underperform or be more volatile than other industries, sectors, markets or asset classes and the general securities market.
There is no guarantee that the classification system used to determine the rotation model or strategy will achieve its intended results. The fund may engage in active and frequent trading of its portfolio securities which may result in higher transaction costs to the fund.
Actively managed funds do not seek to replicate the performance of a specified index, may have higher portfolio turnover, and may charge higher fees than index funds due to increased trading and research expenses. There is no guarantee that an active fund will meet its investment objective.
This material is provided for informational purposes only and is not intended to constitute investment advice or an investment recommendation within the meaning of federal, state or local law. You are solely responsible for evaluating and acting upon the education and information contained in this material. BlackRock will not be liable for direct or incidental loss resulting from applying any of the information obtained from these materials or from any other source mentioned.
BlackRock does not provide tax advice. Tax consequences will vary by individual taxpayer, and investors should carefully evaluate their individual tax position before implementing any tax-related investment strategy. We urge investors to consult with a tax professional regarding the potential tax consequences of any strategy or product discussed in this material. This material does not constitute any specific legal, tax or accounting advice. Please consult with qualified professionals for this type of advice.
Wash sale restrictions prevent investors from realizing a loss on a sale and buying a “substantially identical” security 30 days before or after the sale of the security. While “substantially identical” remains undefined, some tax practitioners suggest that investors consider the degree to which the funds’ holdings may overlap and the degree of difference in prospective returns. The information and examples provided are not intended to be a complete analysis of every material fact relating to a tax strategy and are presented for educational and illustrative purposes only.
The Internal Revenue Service has not released a definitive opinion regarding the definition of "substantially identical" securities and its application to the wash sale rule and ETFs. The information and examples provided are not intended to be a complete analysis of every material fact respecting tax strategy and are presented for educational and illustrative purposes only. Tax consequences will vary by individual taxpayer and individuals must carefully evaluate their tax position before engaging in any tax strategy.
Transactions in shares of ETFs may result in brokerage commissions and may generate tax consequences. All regulated investment companies are obliged to distribute portfolio gains to shareholders. Diversification and asset allocation may not protect against market risk or loss of principal.
The Funds are distributed by BlackRock Investments, LLC (together with its affiliates, “BlackRock”).
The iShares Funds are not sponsored, endorsed, issued, sold or promoted by Nasdaq, Inc. or S&P Dow Jones Indices LLC. Neither of these companies make any representation regarding the advisability of investing in the Funds. BlackRock is not affiliated with the companies listed above.
BlackRock provides compensation in connection with obtaining or using third-party ratings and rankings.
©2026 BlackRock, Inc. or its affiliates. All Rights Reserved. BLACKROCK and iShares are trademarks of BlackRock, Inc. or its affiliates. All other trademarks are those of their respective owners.
MKTG1026-MH-5888471-EXP1027