Inside the market

What history says about 2026 midterm elections and market performance

Nov 16, 2026|ByBenjamin CantrellMark Peterson

Investor takeaways

  • Letting politics guide investment decisions can be costly. Our analysis shows that investors who moved money out of the market when their political party was out of power would have seen returns cut by half compared to those who stayed invested.
  • Annual U.S. stock market returns, on average, have been the weakest in midterm years, but returns in 2026 have proven otherwise: U.S. stocks are up 11.96% year-to-date.1
  • History has shown that markets in divided governments can have improved returns. Based on our analysis, the S&P 500 has generated higher average six-month returns following midterm elections that resulted in divided governments than following those that resulted in unified government.2
  • AI and the data center buildout are central themes in the markets and key issues for this election cycle. The policy landscape is evolving quickly and remains an important area to watch.

Election cycle investing during periods of market volatility

Political headlines have dominated markets this midterm election year. And with a divided government set to take office in 2027, investors may be tempted to pause as the markets react to potential political-related volatility. We believe the more important lesson from history is to stay invested.

In this article, we break down stock market performance during past midterm cycles and those with divided governments, how this cycle fared and reasons to stay invested no matter the prevailing politics.

How have stocks performed during midterm election years?

Annual U.S. stock market returns, on average, have been the weakest in midterm years, rising just 7.5% vs. an average of 12.4% in non-midterm years.3 The two most recent midterm cycles (2018 and 2022), in fact, were the weakest years for the S&P 500 since 2008, with losses of -4.4% and -18.1%, respectively.4 This year stocks are up 11.96% through mid-November.5

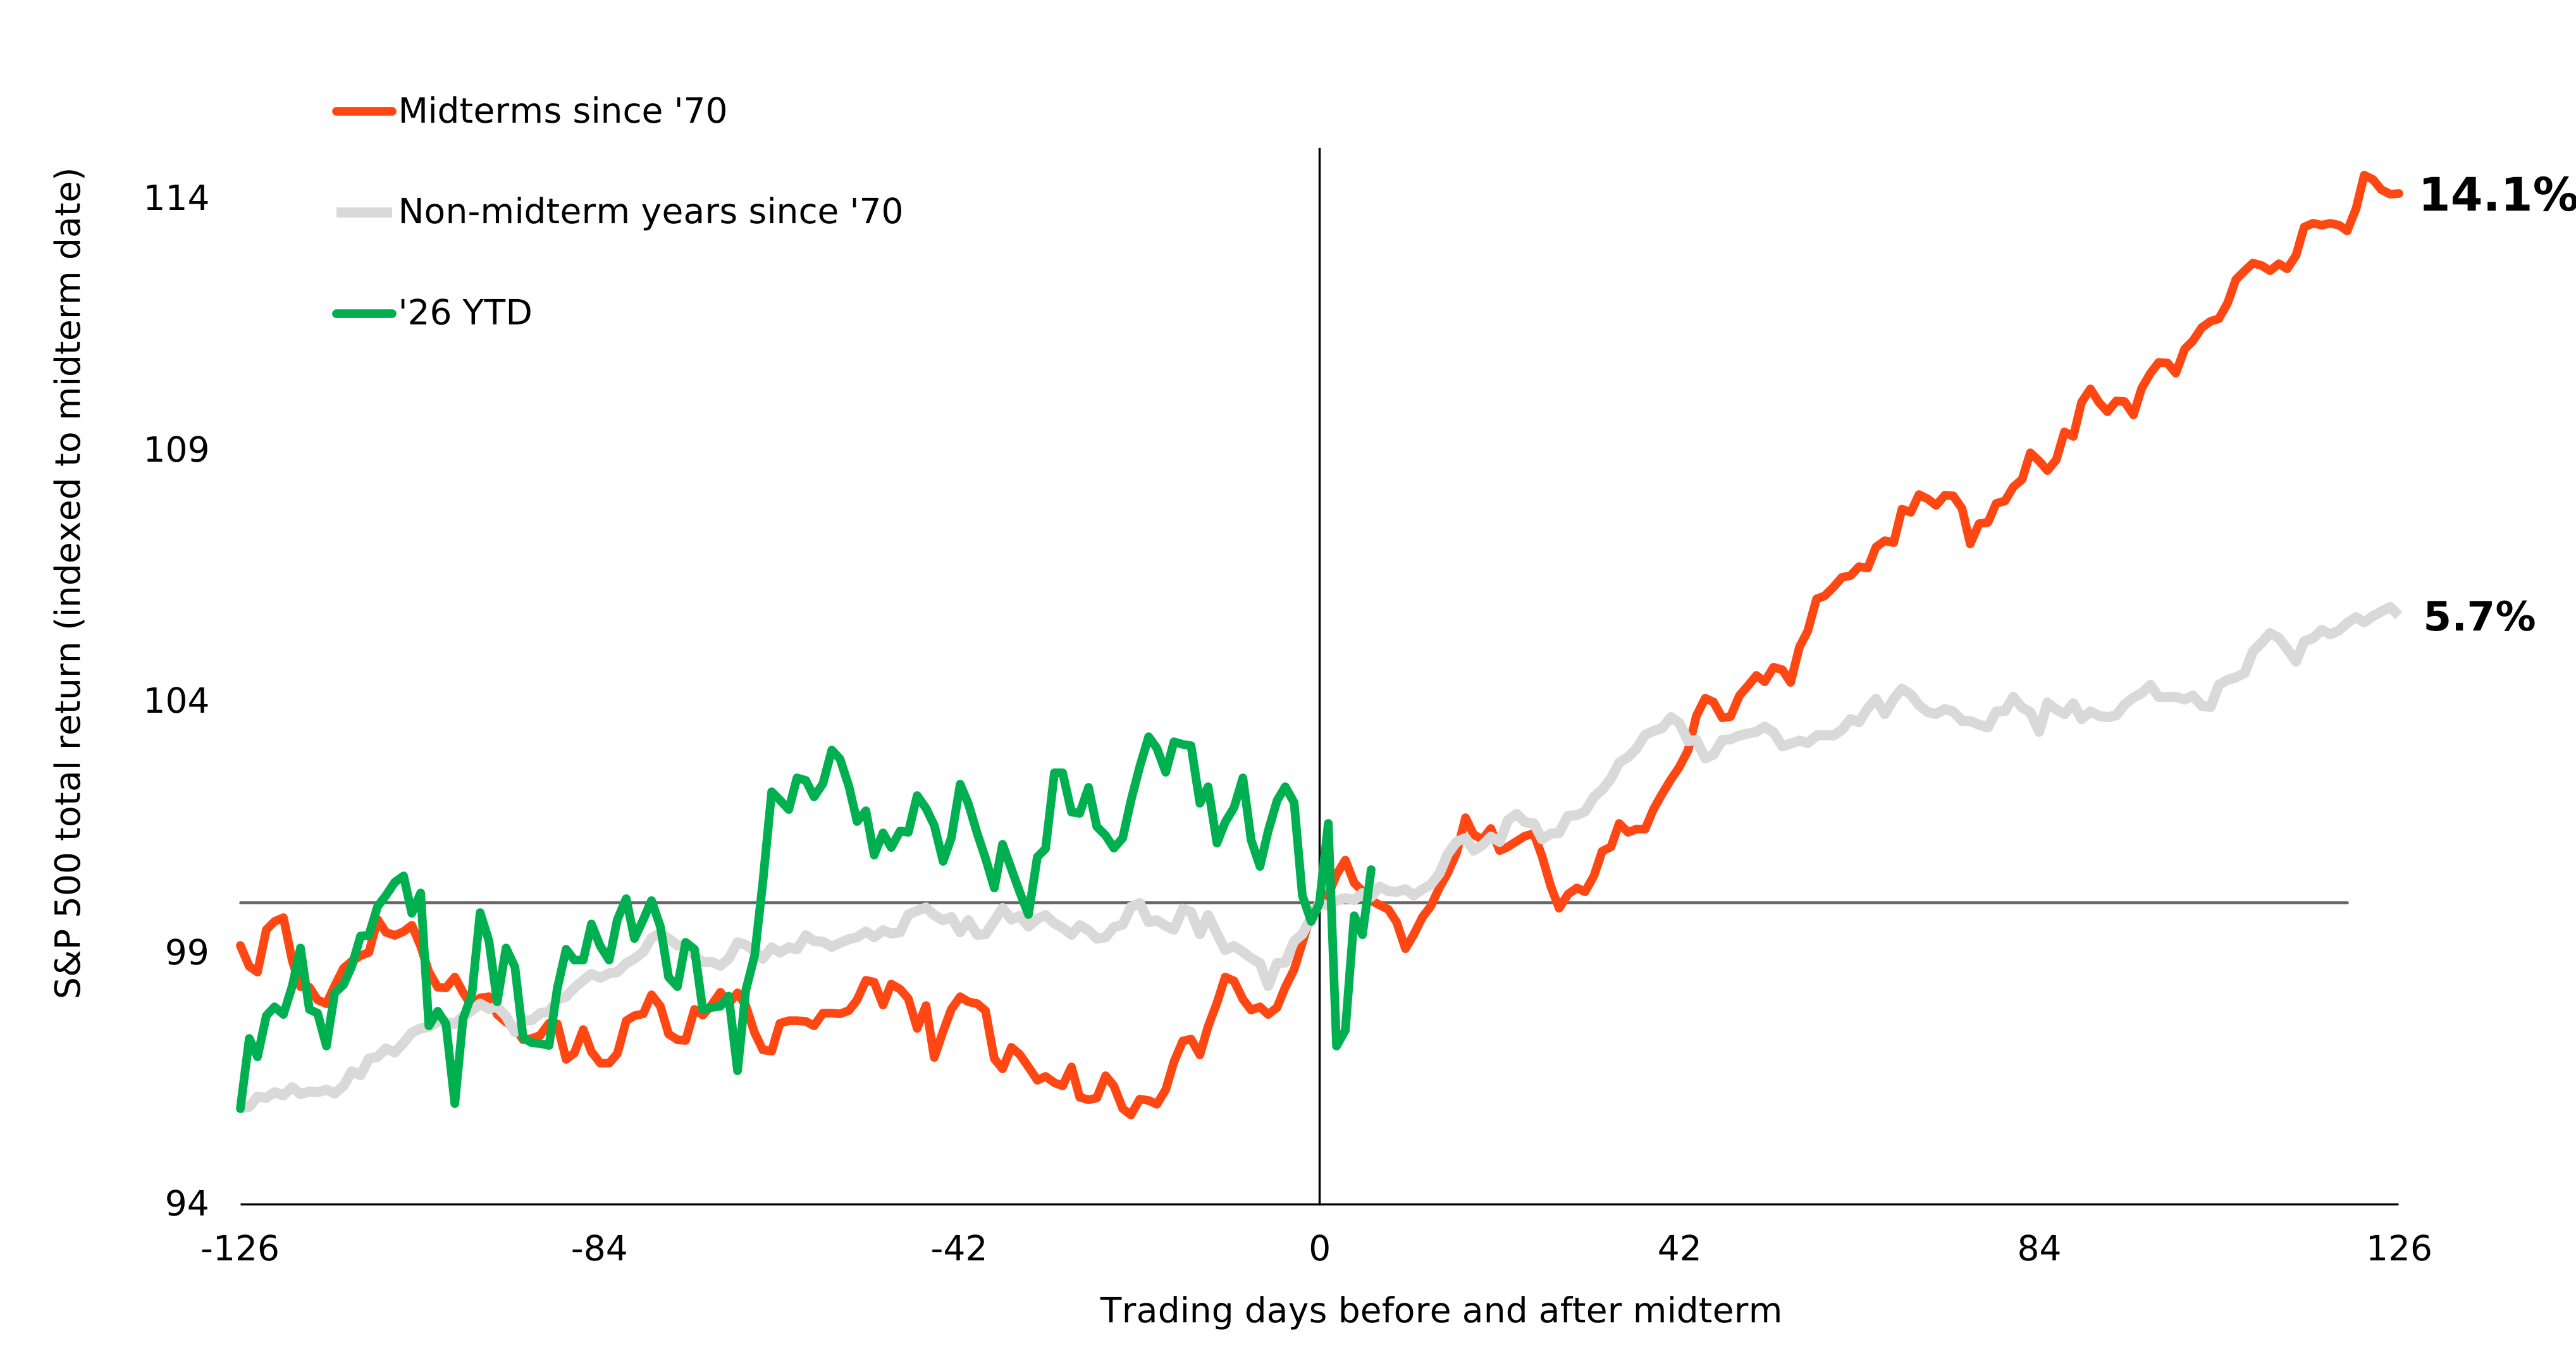
Beyond full-year returns, another historical pattern has emerged around Election Day itself, as shown in Figure 1. Since 1970, the market has rallied on average around a month, or 22 trading days, before a midterm election as polling data provided clearer expectations of the outcome.6 As that uncertainty began to fade, equities pulled higher, with an average return of 14.1% in the six months following the election, compared to just 5.7% in non-midterm years. 7

Yet, as shown in Figure 1, market performance in 2026 has diverged from the historical trend. The S&P 500 fell 2.3% in the month before the election, with losses deepening two days post-election spurred by a sharp sell-off in the technology sector. Yet within a week, the S&P 500 had already rebounded to pre-election levels.8

Figure 1: S&P 500 total return performance, since 1970 indexed to midterm date

chart of S&P 500 total return performance

Source: Bloomberg, data as of Nov. 11, 2026. Based on average S&P total return since 1970 indexed to election dates or hypothetical election dates. Midterm years as follows: 1970, 1974, 1978, 1982, 1986, 1990, 1994, 1998, 2002, 2006, 2010, 2014, 2018, 2022. The “0” on the x-axis represents the Midterm/Presidential election date, which falls on the first Tuesday in November. In non-election years, hypothetical election dates were used. Month approximations based on average of 21 trading days in a month. Y-axis numbers represent total return of approximately 6 months before and after a midterm indexed to midterm date, with the value of the midterm date being 100. Index performance is for illustrative purposes only. Index performance does not reflect any management fees or expenses. Indexes are unmanaged and one cannot invest directly in an index. Past performance does not guarantee future results.

How have the markets performed in divided and unified governments? 

Midterm elections have historically resulted in a shift in the balance of power in Washington, often leaving control of the White House and Congress divided between the two parties. Historically, equities have performed well following midterms under both divided and unified government, with 14.9% average S&P 500 price returns six months after elections resulting in divided government compared with 12.0% under unified government.9

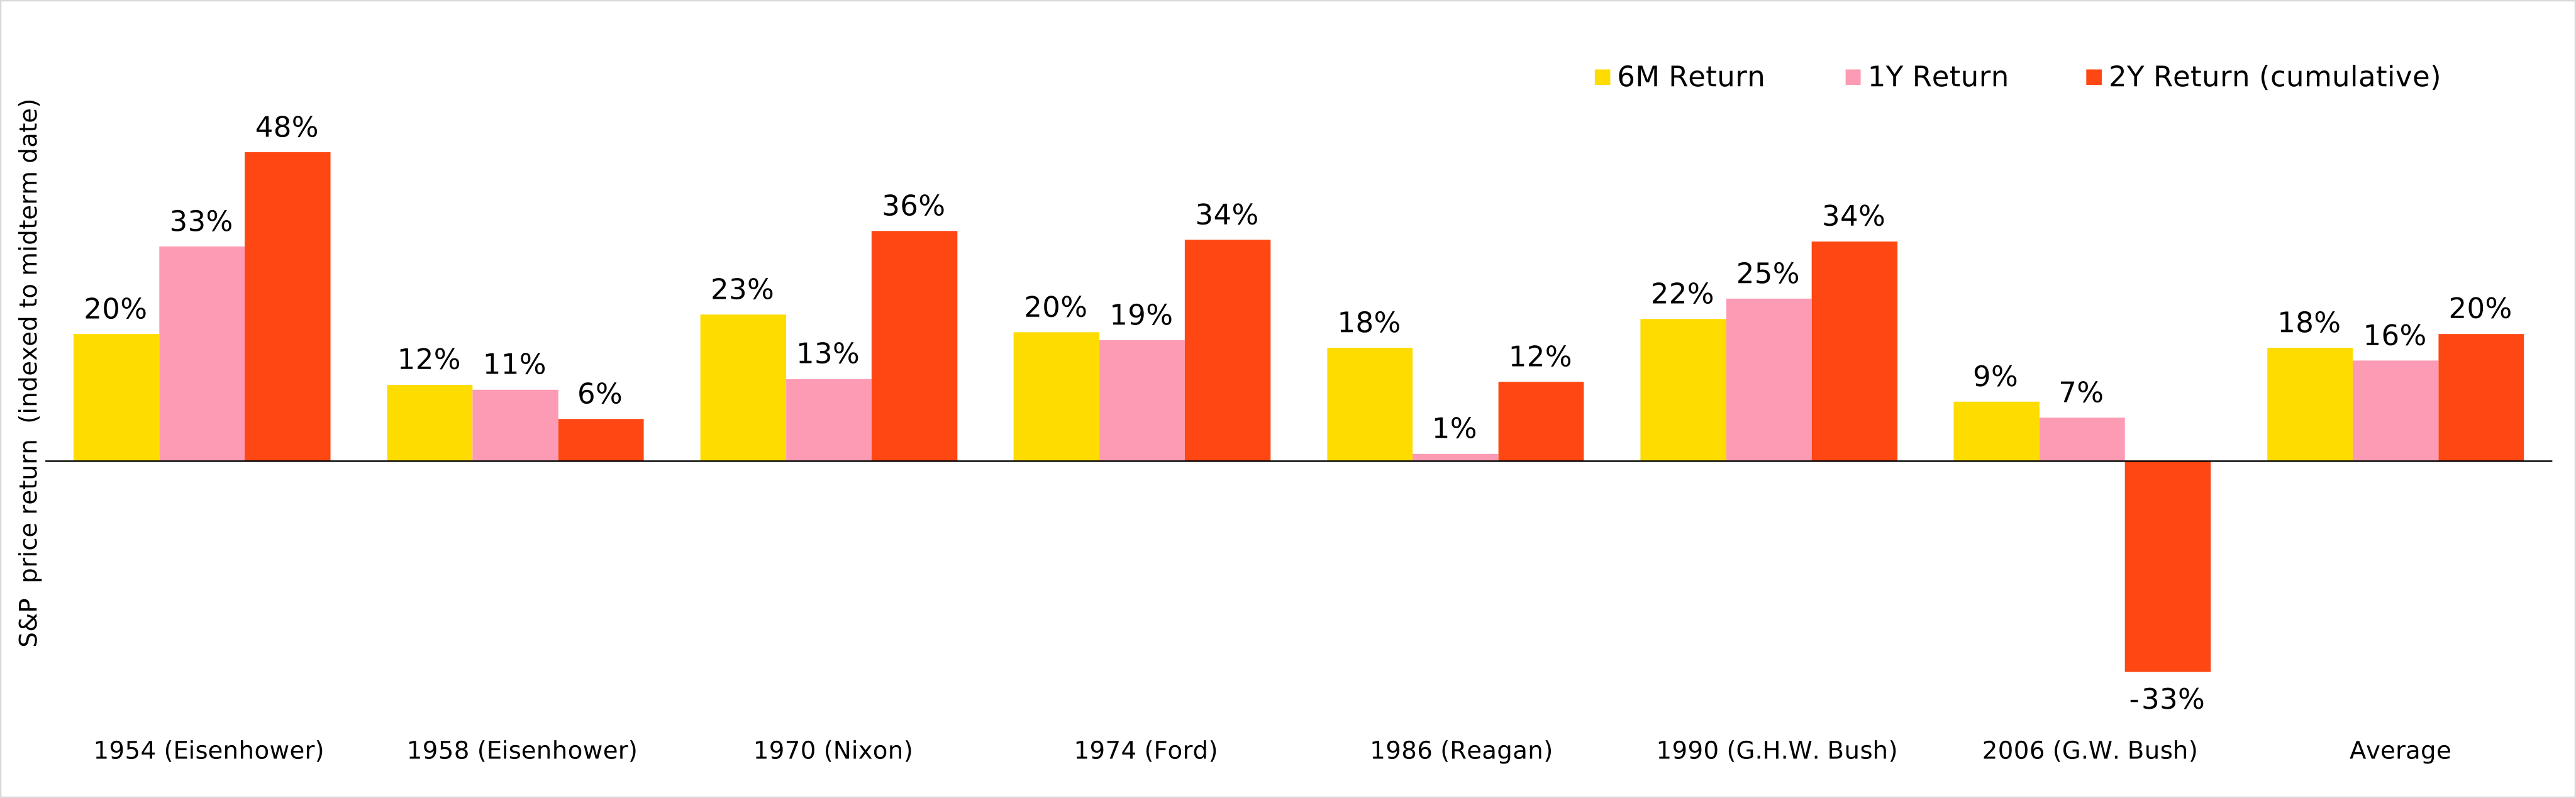
The 2026 midterms resulted in divided government, with Democrats winning control of both chambers of Congress while a Republican President remains in the White House. History suggests this outcome has still provided a constructive backdrop for equities: as shown in Figure 2, past midterms that left a Republican president facing Democratic control of both chambers have been followed by double-digit average S&P 500 price returns over the subsequent six months, one year, and two years.10 This also aligns with the broader presidential cycle: the third year of a presidential term has historically been the strongest for equities, with the S&P 500 averaging a 17.2% price gain since 1950, nearly double the 9.4% average across all years, and finishing higher in 17 of 19 instances.11

Figure 2: S&P 500 Returns After Midterms (Since 1950): Republican President, Democratic Congress

chart of sector performance average annual return for length of presidency by S&P500 sector

Source: Bloomberg, data as of Nov. 9, 2026. Based on S&P 500 price return following midterm elections since 1950. Midterms in which a Republican president faced Democratic control of both the House and the Senate: 1954, 1958, 1970, 1974, 1986, 1990 and 2006 (7 instances). Returns are calculated as of the close of the midterm election date, which falls on the first Tuesday in November. 2-year returns are cumulative, not annualized. Index performance is for illustrative purposes only. Index performance does not reflect any management fees or expenses. Indexes are unmanaged and one cannot invest directly in an index. Past performance does not guarantee future results.

AI has been a central driver of markets. What could the election mean for the theme?

One political issue that has seen increased attention this cycle is Artificial Intelligence (AI)/ Super Intelligence (SI) and data centers. AI investment has been an important strategic and economic priority, but as the scale accelerates at a rapid pace, many are paying attention to the potential impacts of the infrastructure on communities. AI has also been a key theme in our Investment Directions report, where we highlight its expanding role in markets and the economy.

Data centers are central to the buildout of AI and are being built throughout the country. Local concerns have accompanied the buildout as some voters voice opposition given the potential resource demands of data centers. At the same time, "Bring Your Own Power" initiatives are emerging where those involved in the buildout (such as AI companies and data center developers) are moving toward funding, building or otherwise procuring the capacity needed for their infrastructure.

Policymakers took notice, as Ohio expanded the number of local ballot measures seeking data center moratoriums and Texas increased auditing in the building process.12 13 Meanwhile, some policies have underscored the “Bring Your Own Power” approach: Virginia’s recently proposed framework supports investment in new, clean energy sources to make it easier for data centers to build their own power supplies. The policy landscape is evolving quickly and remains an important area to watch.

The magnitude of the Democratic victories in the 2026 midterms has brought data center regulation into sharper focus, particularly at the state and local level: across 41 local ballot initiatives nationwide, voters overwhelmingly favored restricting new development.14 On Nov. 5, just two days after the election, the Nasdaq fell 6% in its worst day since the Covid-19 plunge of March 2020, and semiconductors dropped 10% (reducing gains for the year to 29%, from a peak of 107% in June).15 The selloff was particularly severe across the companies most exposed to the AI infrastructure buildout.

But we believe post-election volatility in AI stocks appears more like a reassessment of how quickly AI infrastructure can be built rather than a change in the underlying demand for it. As demand for AI infrastructure and capacity expands, we continue to see a significant long-term opportunity in related investments. Read more on recent AI volatility and our long-term view in our latest iShares article here.

What midterm elections, politics and a change in government control could mean for investor portfolios

For investors, the biggest question is what electoral results may mean for portfolio decisions now. The historical lesson may be less about predicting periods of volatility and more about avoiding reactive portfolio decisions when they occur.

Since 2013, a $100,000 investment in the S&P 500 would have grown to $398,000 by the start of 2026 if left fully invested. But investors who moved their money out of the market to cash whenever their preferred political party was out of power saw dramatically lower returns - ending with $214,000 (Republican-timed exodus) or $186,000 (Democrat-timed). Letting politics guide investment decisions has come at a significant cost.16

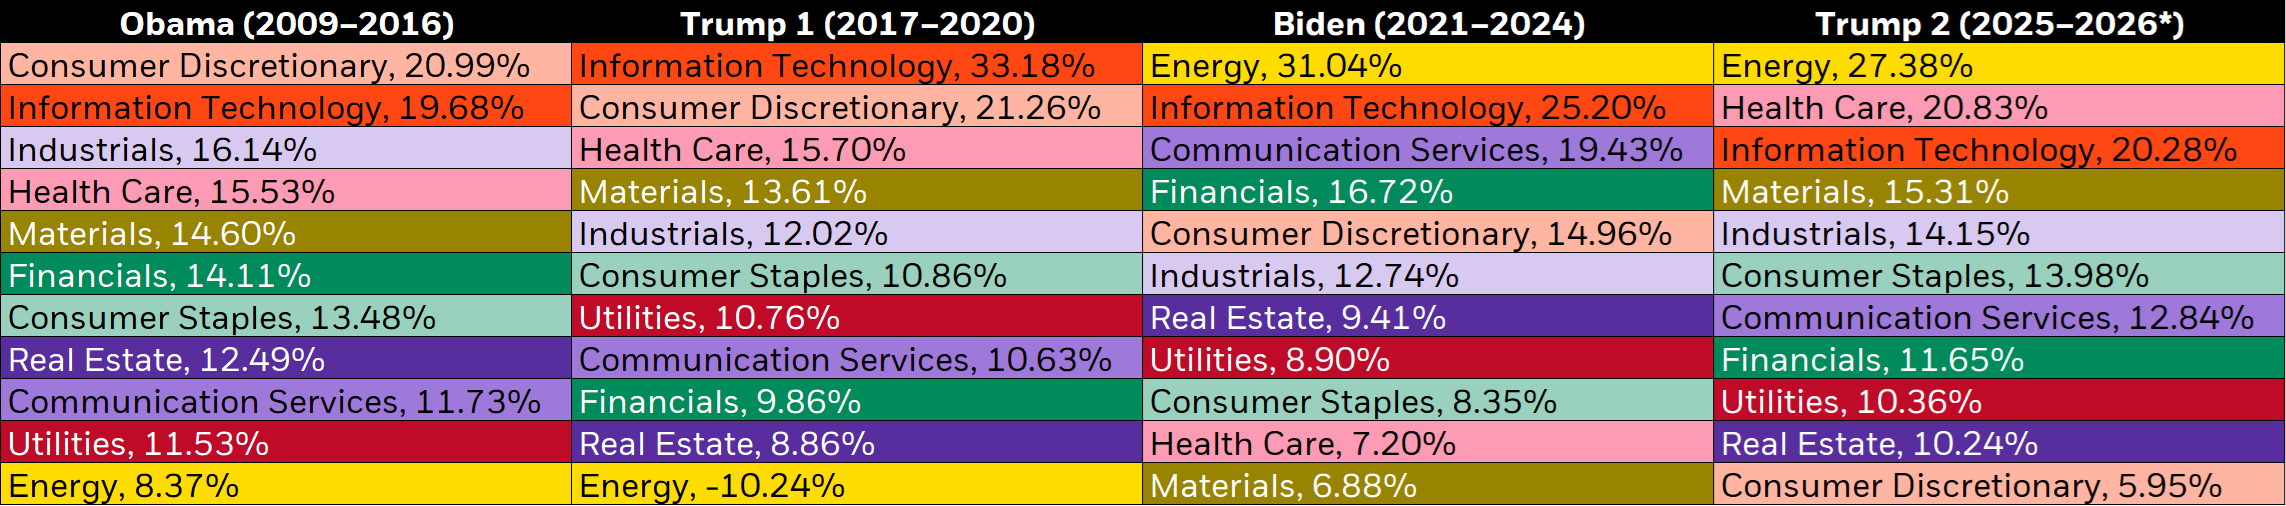
That dynamic has also shown up at the sector level. Investors have often mapped sectors to political outcomes, but market leadership has rarely followed a party script. As shown in Figure 3, Energy, for example, was the worst-performing sector under Obama’s presidency and Trump’s first term, yet among the best under Biden and Trump’s second. Meanwhile, Technology has consistently ranked among the top three sectors across the last four presidencies. Sector performance varies - but it has been far less tied to politics than many assume.

Portfolios may be best served when they are built around core, low-cost ETFs rather than narrative-led trading.

Figure 3: Sector performance (average annual return for length of presidency by S&P 500 sector)

Sector performance (average annual return for length of presidency by S&P 500 sector)

Source: BlackRock, Bloomberg as of Nov. 9, 2026. Sectors reflect respective S&P GICS Level 1 classifications. Figures represent the average annual total return for each administration, based on the following calendar years: Obama (2009–2016), Trump I (2017–2020), Biden (2021–2024), and Trump II (2025–2026). *2026 returns are annualized using data through 11/9/2026. Past performance does not guarantee or indicate future results. Index performance is for illustrative purposes only. You cannot invest directly in the index.

Bottom line: Election-year volatility in perspective

Investors may be tempted to pause as markets react to the 2026 midterm elections and the resulting change in power, but the more important historical lesson is to remain invested. Rather than making sweeping sector bets based on political assumptions, investors may be better served by focusing on long-term discipline and broad market exposure. For even more on how staying invested in election cycles matters, please check out our Student of the Market: Midterm Election Year Special.

Performance data represents YTD performance. Performance data quoted represents past performance. Past performance and does not guarantee future results. Investment return and principal value will fluctuate with market conditions and may be lower or higher when you sell your shares. Current performance may differ from the performance shown. For most recent month-end performance and standardized performance, click on the fund names above.

The Morningstar RatingTM for funds, or "star rating", is calculated for managed products (including mutual funds, variable annuity and variable life subaccounts, exchange-traded funds, closed-end funds, and separate accounts) with at least a three-year history. Exchange-traded funds and open-ended mutual funds are considered a single population for comparative purposes. It is calculated based on a Morningstar Risk-Adjusted Return measure that accounts for variation in a managed product's monthly excess performance, placing more emphasis on downward variations and rewarding consistent performance. The top 10% of products in each product category receive 5 stars, the next 22.5% receive 4 stars, the next 35% receive 3 stars, the next 22.5% receive 2 stars, and the bottom 10% receive 1 star. The Overall Morningstar Rating for a managed product is derived from a weighted average of the performance figures associated with its three-, five-, and 10-year (if applicable) Morningstar Rating metrics. The weights are: 100% three-year rating for 36-59 months of total returns, 60% five-year rating/40% three-year rating for 60-119 months of total returns, and 50% 10-year rating/30% five-year rating/20% three-year rating for 120 or more months of total returns. While the 10-year overall star rating formula seems to give the most weight to the 10-year period, the most recent three-year period actually has the greatest impact because it is included in all three rating periods.

BlackRock provides compensation in connection with obtaining or using third-party ratings, rankings, or data.

Mark Peterson
Director, Market & Portfolio Insights
Benjamin Cantrell
Director, Federal Government Affairs