Capital as risk. Marketing Material.
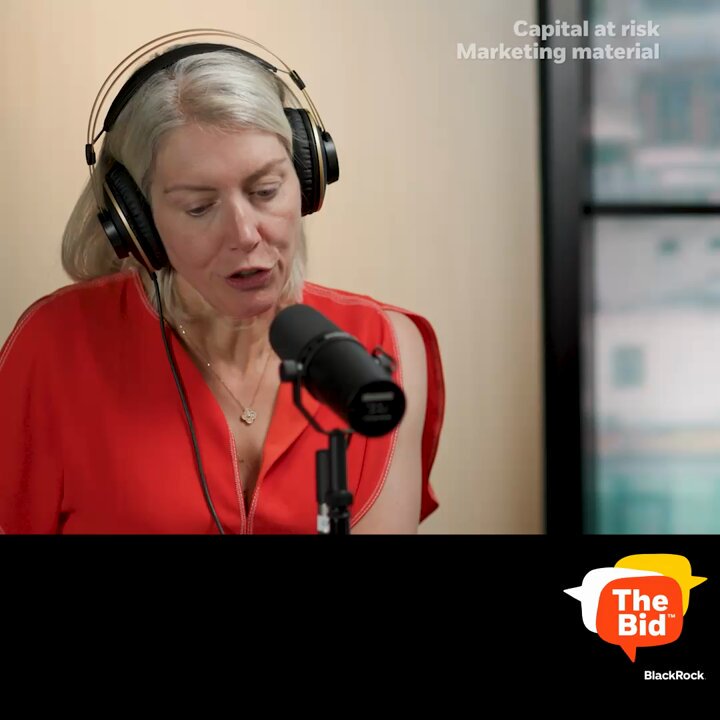
Pull up a chair, grab a cup of coffee, and get comfortable as we dive into the world of INVESTMENT TRUSTS.
Imagine you're embarking on a journey to build an investment portfolio. You want to explore various opportunities, but navigating that vast landscape of investment options can be overwhelming. What if there was a way to simplify this process and have a team of experts manage a range of investments for you? Well, that's where Investment Trusts come in.
Imagine you're embarking on a journey to build a diversified investment portfolio. You want to explore various opportunities, but navigating the vast landscape of investment options can be overwhelming. What if there was a way to simplify this process and have a team of experts manage a range of investments for you? Well, that's where Investment Trusts come in. So, pull up a chair, grab a cup of coffee, and get comfortable as we dive into the world of INVESTMENT TRUSTS.
First things first, what exactly is an Investment Trust? An Investment Trust is a public limited company that aims to make money by investing in other companies or assets. It is a type of collective investment fund, so think of it as a basket of investments, managed by professionals and overseen by an Independent Board. By owning shares in an Investment Trust, an investor is able to invest in a variety of companies.
So, what makes Investment Trusts unique when compared to other investment options? One. They’re Professionally Managed. Investment Trusts are managed by experienced fund managers who make decisions on behalf of shareholders (that’s the likes of you and me). Two. They’re listed on a Stock Exchange. Investment Trusts’ shares are listed on the London stock exchange, where investors can buy and sell their shares through an investment platform. Three. they have a closed-ended Structure. Investment trusts have fixed share capital at launch, and their shares trade on the stock exchange; this means that investors can buy and sell their shares intra-day and the fund manager is not forced to sell underlying investments to fund redemptions in the same way an open-ended fund is. The manager therefore has the ability to invest for a longer time horizon and it mitigates the need for the manager to sell down assets at points in the investment cycle that might not be opportune. Four. they have revenue Reserves. Investment Trusts have the ability to retain some of the income generated by their assets. And this helps them to maintain steady dividend payments to investors. Oh, by the way, a dividend is a portion of a company's earnings that is paid to its shareholders as a reward for their investment. They can be paid in cash or reinvested back into the stock. During a recession for example, when many companies cut dividends, Trusts can use their reserves to keep or even increase their dividends payments. And this can be attractive to investors who depend on the income from their investments.
Investment Trusts come in various flavours, each aiming to cater to different investment goals. And can invest in different asset classes or themes, be it equities, debt and alternatives such as infrastructure, renewables, property.
An independent board of directors is elected by shareholders to oversee the good governance of the Company and look after shareholder interests. The directors meet several times a year and review the trust's performance. They also answer to the shareholders, meaning investors have a say in how the trust is run. This allows shareholders to vote on issues at the Trust’s Annual General Meetings or AGMs as they like to be called, or vote in new directors if dissatisfied with the current ones, for example. The board also chooses a professional portfolio manager to manage the company's investments. So, the board of directors plays a really crucial role in an Investment Trust!
Investment Trusts can trade at a premium or a discount to their NAV. Before I explain what that means, I should explain what NAV is.
NAV, or Net Asset Value per share, is the total value of the trust's assets minus its liabilities (these are financial obligations or debts that the trust owes), divided by the number of shares. Okay, now back to premiums and discounts. Let’s say an investor buys and sells shares at the listed share price. If the share price is higher than the NAV per share, the investment trust is trading at a premium. This means there is strong demand for the shares. If the share price is lower than the NAV per share, the investment trust is trading at a discount. This means there is less demand for the shares, with more shareholders wishing to sell their shares than there are buyers.
Fluctuations in the level of premium or discount are driven by the supply and demand for the trust's shares which can be influenced by a range of factors, including market sentiment, and the performance of the underlying assets. It might seem that if shares are trading at a discount, this is a bad thing, but that is not necessarily the case. The share price might have fallen because of wider negative market sentiment for example when COVID-19 first broke.
A portfolio trading at a discount might even represent a bargain opportunity to buy very cheaply.
Turning to premiums, investment trusts trading at a premium are in high demand. This can be because of strong performance or positive market sentiment. However, investors buying into a premium-rated investment trust have to pay a share price that is higher than the value of the underlying assets in the portfolio. Investment trusts trading on a premium carry the risk of sliding to a discount if demand for the shares falls.
Gearing is a term you'll often hear when discussing Investment Trusts. As a listed company, Investment Trusts can borrow money from banks so that they can invest more in potential opportunities or investments. The idea is simple: the borrowed money is invested aiming to earn additional returns in excess of the interest due on the loan. If successful, the more the trust borrows, the more profit it makes. However, if the investment fails, the more it borrows, the more it loses. Therefore, the more an Investment Trust borrows, the riskier it becomes. While gearing can help amplify gains, it can also increase losses. It's a double-edged sword that needs to be managed carefully.
There are more ways than ever for investors to invest in an Investment Trust. Alongside traditional routes via stockbrokers, ISAs and Private Pensions, fund supermarkets and platforms can also offer a range of Investment Trusts.
It wouldn’t be an episode of BlackRock Basics without a wrap up!
One. Investment Trusts can offer unique advantages to investors due to their closed-ended structure, which allows fund managers to focus on long-term investments without the pressure of investor redemptions. Two. An investment trust’s ability to use gearing can also potentially enhance returns, although it also increases risk. Three. The premium/discount mechanic can provide opportunities for investors to buy shares at a discount to their NAV, potentially increasing their returns. Four. Investment Trusts have the ability to retain a revenue reserve which can help maintain dividend payments in difficult times. And finally, five. The fact that they are professionally managed and overseen by an independent board. For some investors, this adds an extra level of oversight and accountability providing them with more confidence that their interests are being protected and that the trust is being managed effectively. However, it's important to note that investment trusts come with risks such as market fluctuations, liquidity issues, and the potential for trading at a discount to NAV, which can impact the value of your investment. Overall, it is imperative that you do your homework, including reading fund documentations to understand the risks before investing.
Risk Warnings
Capital at risk. The value of investments and the income from them can fall as well as rise and are not guaranteed. Investors may not get back the amount originally invested.
Past performance is not a reliable indicator of current or future results and should not be the sole factor of consideration when selecting a product or strategy.
Changes in the rates of exchange between currencies may cause the value of investments to diminish or increase. Fluctuation may be particularly marked in the case of a higher volatility fund and the value of an investment may fall suddenly and substantially. Levels and basis of taxation may change from time to time.
Important Information
In the UK and Non-European Economic Area (EEA) countries: this is issued by BlackRock Investment Management (UK) Limited, authorised and regulated by the Financial Conduct Authority. Registered office: 12 Throgmorton Avenue, London, EC2N 2DL. Tel: + 44 (0)20 7743 3000. Registered in England and Wales No. 02020394. For your protection telephone calls are usually recorded. Please refer to the Financial Conduct Authority website for a list of authorised activities conducted by BlackRock.
Any research in this document has been procured and may have been acted on by BlackRock for its own purpose. The results of such research are being made available only incidentally. The views expressed do not constitute investment or any other advice and are subject to change. They do not necessarily reflect the views of any company in the BlackRock Group or any part thereof and no assurances are made as to their accuracy.
This document is for information purposes only and does not constitute an offer or invitation to anyone to invest in any BlackRock funds and has not been prepared in connection with any such offer.
© 2025 BlackRock, Inc. All Rights reserved. BLACKROCK, BLACKROCK SOLUTIONS, and iSHARES are trademarks of BlackRock, Inc. or its affiliates All other trademarks are those of their respective owners.
MKTGSH0425E/S-4356439

