"Judge a man by his questions rather than his answers." - Voltaire
Voltaire probably didn't have the 10-year Treasury in mind, but the principle translates. The Federal Reserve (Fed) raised rates this month, bringing the policy rate to 3.75%-4.00%, and every commentator within earshot has an eight-word explanation for what it means. Markets in September 2026 are drowning in answers: the energy shock, fiscal deficits, higher-for-longer Fed policy, Treasury supply, the next consumer price index (CPI) print, and the next jobs report. What almost nobody is doing is asking the questions that actually determine investment returns from here. We think the best investors don't have more answers; they ask better questions. The structural questions facing us today are unusually clear and important and, for those willing to act on them, potentially well-compensated.
U.S. economic growth: Strong headline, fractured underneath
Is the economy strong? Yes. Is it uniformly strong? Not even close. Corporate profits are growing at a rate consistent with 7% nominal GDP growth, a level that points to strong expansion.1 But peel back one layer and the picture changes dramatically. Growth is increasingly concentrated in rate-insensitive services and nonresidential investment, particularly AI-related capital expenditure. Computers and peripheral equipment represent roughly 1% of GDP but have generated approximately 27% of recent growth.2 That is not broad-based growth; it is a capex boom channeled through an extraordinarily narrow pipe.
Meanwhile, sectors most sensitive to financing costs, housing chief among them, remain in something resembling a recession. The income needed to qualify for a median-priced home has reached $125,000, nearly double the median household income, while the average age of a first-time homebuyer has climbed to 40.3 For the first time on record, households in the fourth income quintile may not be able to afford today's median-priced home.
Chair Warsh said this week that policy is "not restrictive" given the headline strength of the economy, and the aggregate data supports that view. But the composition says something far more useful for investing: monetary policy is biting hard in some places while barely touching others.
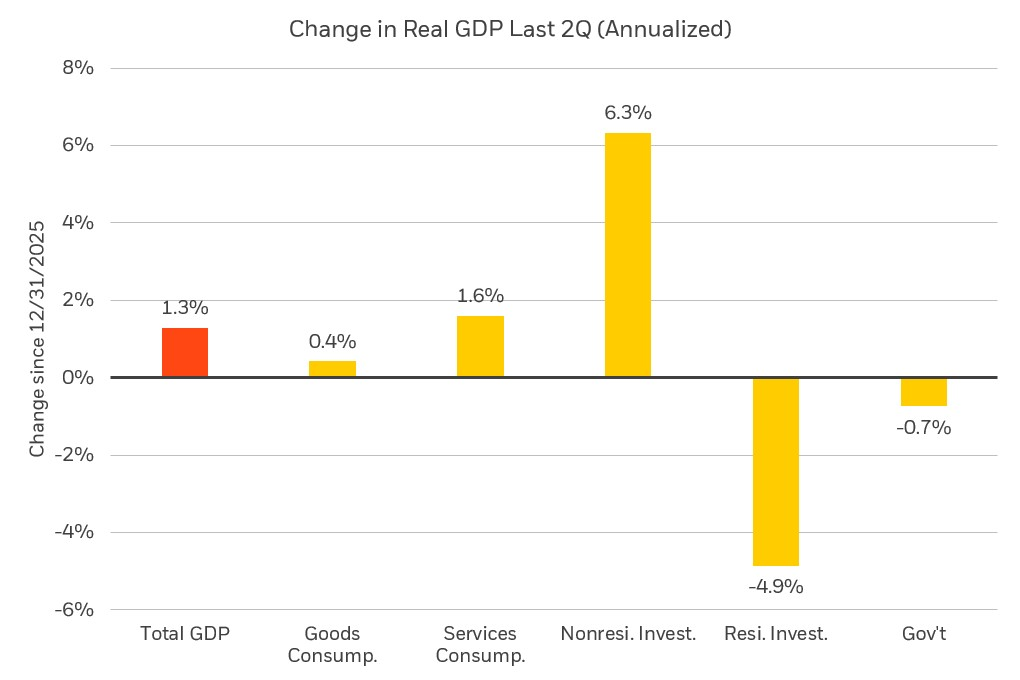
Source: Bloomberg, Bureau of Economic Analysis, as of June 30, 2026
Inflation and Fed policy: The wrong question is “how high?” the right one is “how responsive?”
This month's 25-basis point rate increase was widely anticipated, while the updated Summary of Economic Projections leaned hawkish. The 2026 median dot now implies two hikes (4.125%), with 2027 and 2028 medians each raised by 50 basis points, suggesting policy remains on hold next year before a cut in 2028. The Fed also revised 2026 core personal consumption expenditures (PCE) inflation a tenth higher to 3.4%, though we suspect officials did not incorporate expected negative methodology revisions due later this month, that could lower the reported number. Chair Warsh was clear in his press conference: progress on underlying inflation has been "inadequate," and he views the economy as strong enough that policy is not yet restrictive.
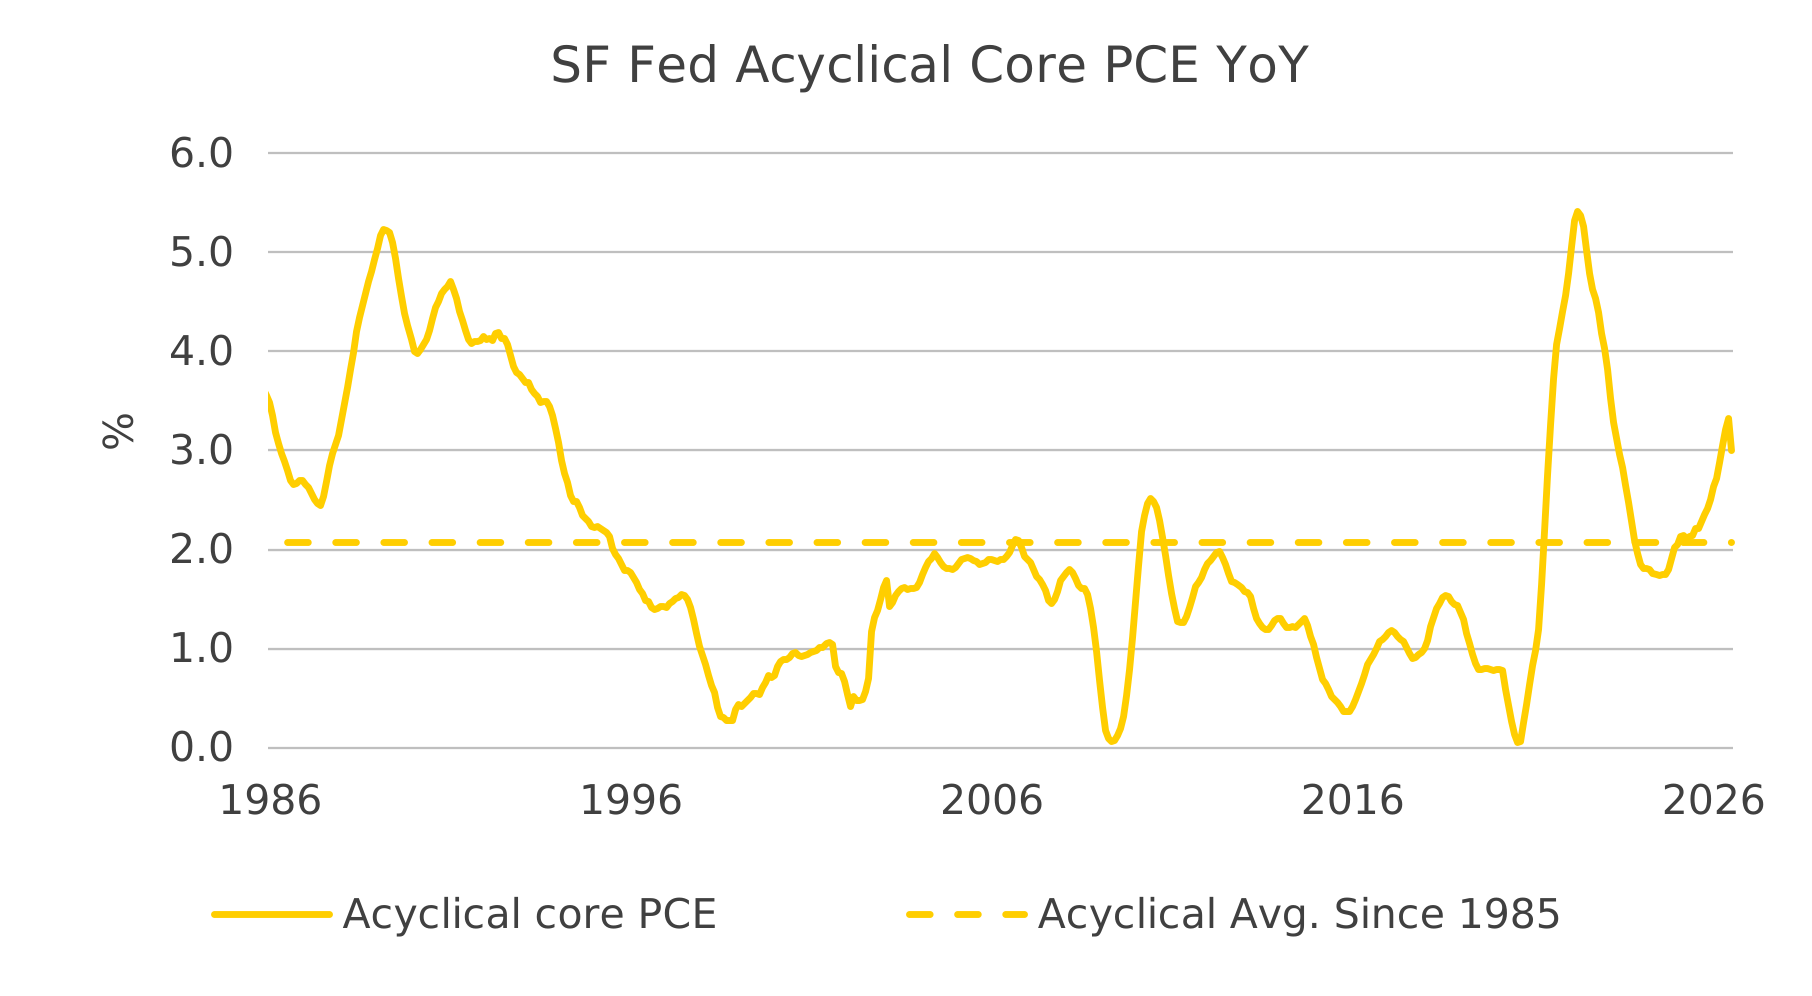
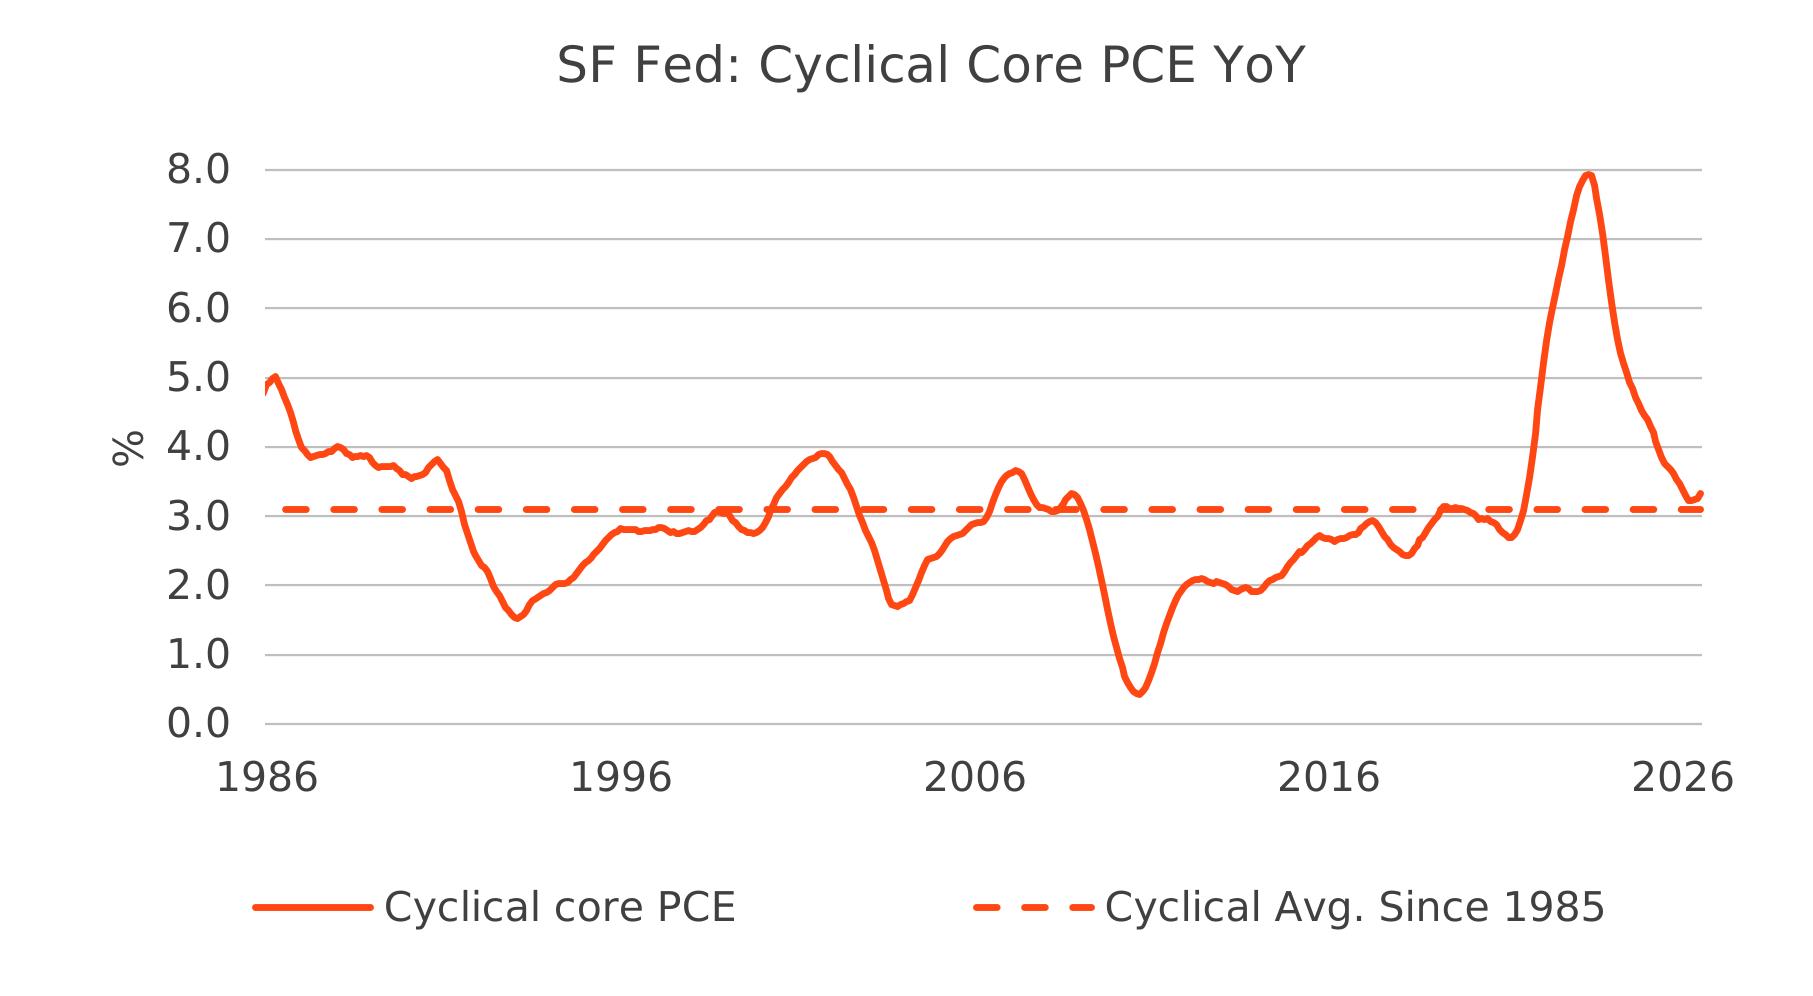
We agree that the economy has appeared remarkably resilient at the aggregate level, and that modest further rate increases may not put overall growth at risk. But the more important question for portfolios is not the level of inflation; it is its sensitivity to rates. The drivers of today's inflation are increasingly acyclical: energy, insurance, healthcare, education, and products tied to chips and asset prices. The San Francisco Fed's acyclical versus cyclical framework illustrates the divergence. Cyclical components have normalized toward long-term averages, while the acyclical portion continues to push headline inflation higher.
Acyclical components are driving more of today's inflation
Source: Federal Reserve Bank of San Francisco, as of Aug. 31, 2026.
Source: Bureau of Economic Analysis, as of Aug. 31, 2026.
The Fed is committed to returning inflation to its 2% target, and inaction is clearly not its preferred route. Yet higher rates bite hardest in the housing and consumer borrowing channels that are already under stress, with the 90-day credit card delinquency rate at 12.9%.4 Higher rates do relatively little to slow the AI-fueled investment cycle or global energy dynamics driving the acyclical components. It is the equivalent of turning down the thermostat in one room and wondering why the other room isn't getting cooler. For investors, understanding inflation composition matters far more than tracking the headline number. We don't think this rate increase necessitates a long series of further increases, particularly with employment growth having weakened materially from the pace of recent years.
AI productivity and the labor market: Profits without paychecks
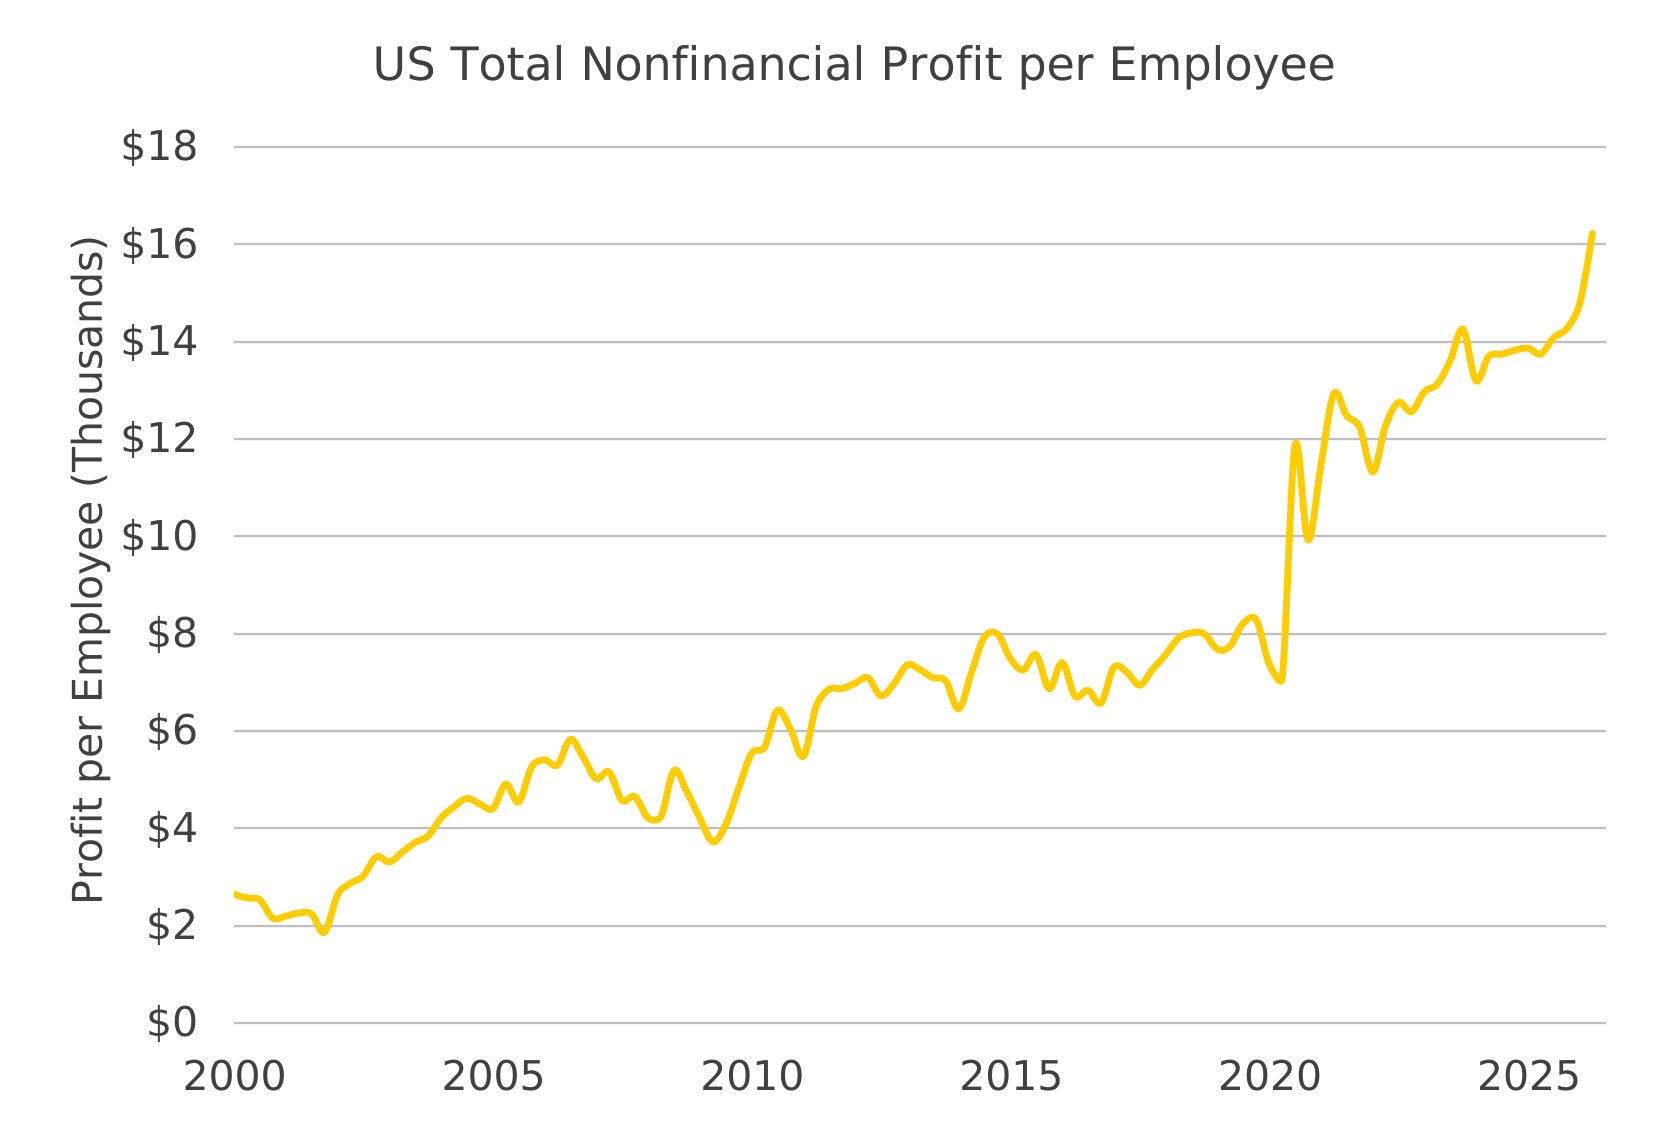
The labor market shows why the right question matters. Is employment strong? At 4.1% unemployment, sure. But the hires rate is at its lowest since 2010, and private-sector wage growth has cooled to 3.1%. Strip out healthcare, and average monthly payroll growth over the past year is just 6,000 jobs.5 Economy-wide profit per employee is growing faster than at any point in the last 25 years (outside the rebounds following the global financial crisis and COVID), while many industries are growing output without hiring at all.
Productivity was rising well before AI, which is now accelerating the trend. The right questions for investing are: how durable is this corporate profit cycle, how much will AI amplify it further, and what happens to economy-wide consumption when the winners and losers diverge this sharply? These are not questions the market can answer with a single payroll print or a Fed dot plot. They are structural, and the portfolio implications extend well beyond the next meeting.
Profit per employee is growing at a historically strong pace
Source: Bureau of Economic Analysis, as of Aug. 31, 2026.
Retail investing and market structure: The fantasy football problem
Sports betting is now a $17 billion revenue industry in the U.S., up 23% in 2025, and that same impulse is increasingly visible in financial markets.6 Zero-day-to-expiry options continue to take a larger share of total U.S. options volume. Leveraged ETF launches have surged, with almost 200 new ones this year carrying an average AUM of just $3.9 million.7 The dynamic resembles fantasy football: the game outside the arena can become bigger than the game itself. The obsession with what happens in the next minute, hour, or day can undermine the discipline of compounding capital over years. The structural questions, not the daily answers, are what generate returns.
Fixed income yields: The math has rarely been this powerful
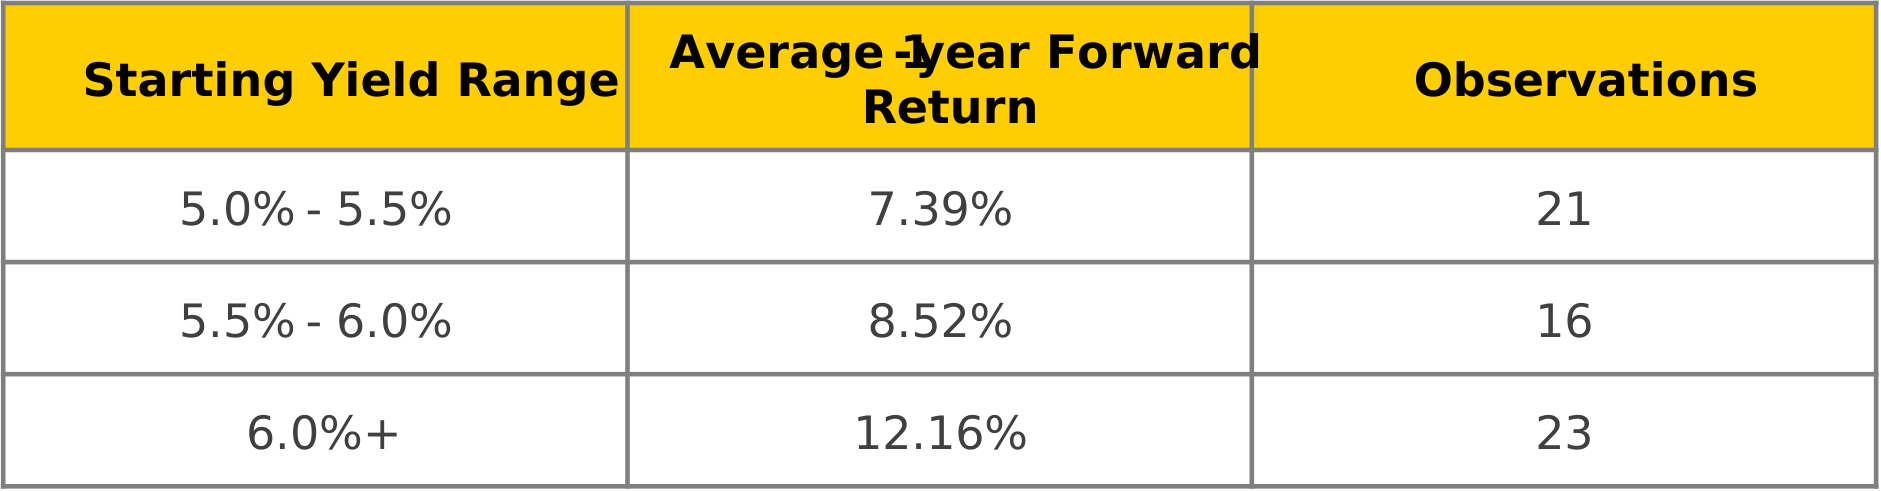
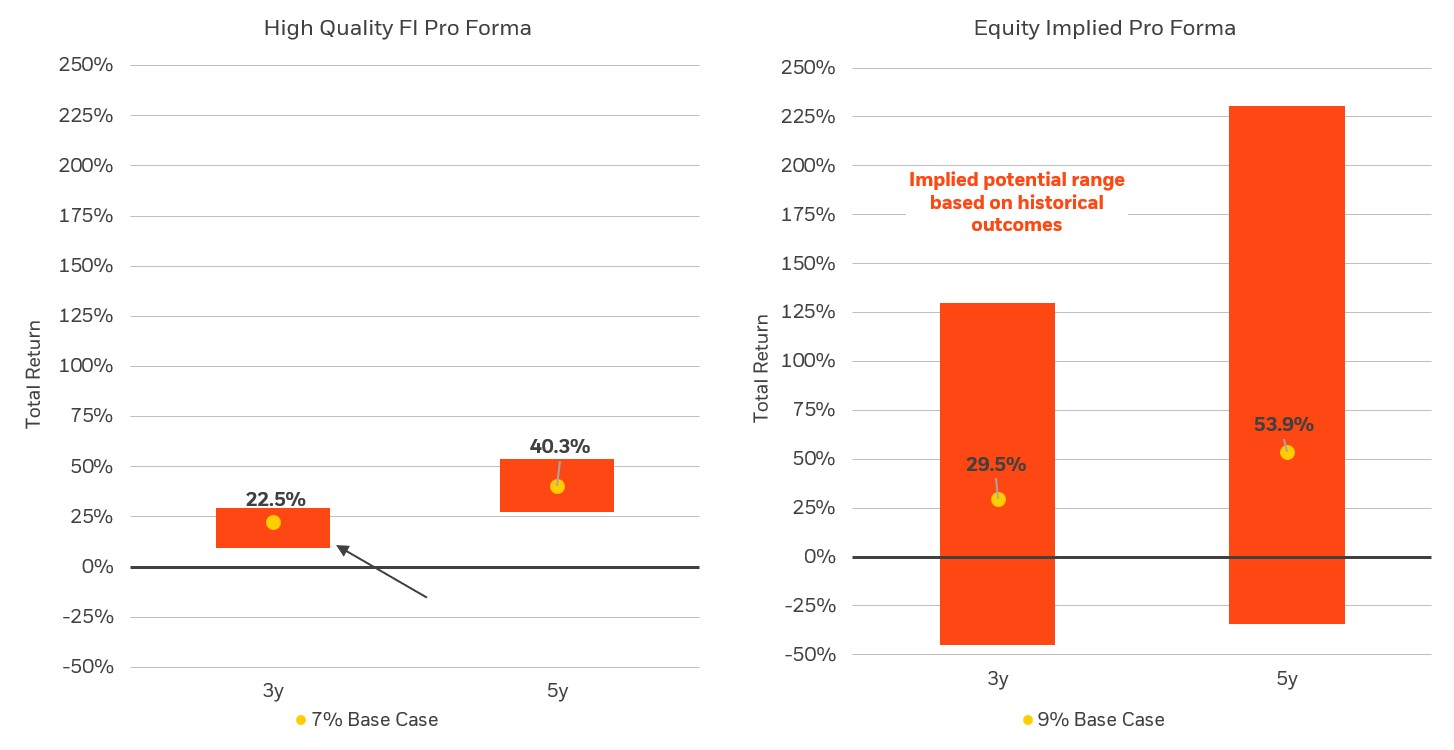
For all the debate about current rate levels, the more useful question for investors is: What return can be generated from this starting point? The answer is compelling. What makes today’s opportunity unusual is that investors do not need to reach very far for that income. It’s now possible to build a diversified fixed income portfolio yielding more than 7%, with less than three years of duration and an average credit rating of A-.8 That combination of income, quality and limited interest-rate sensitivity is historically unusual, particularly as inflation continues to moderate.
US 10Y Treasury Average 1Y Forward Returns since 1995 by Starting Yield
Source: Bloomberg, as of Sept. 11, 2026.
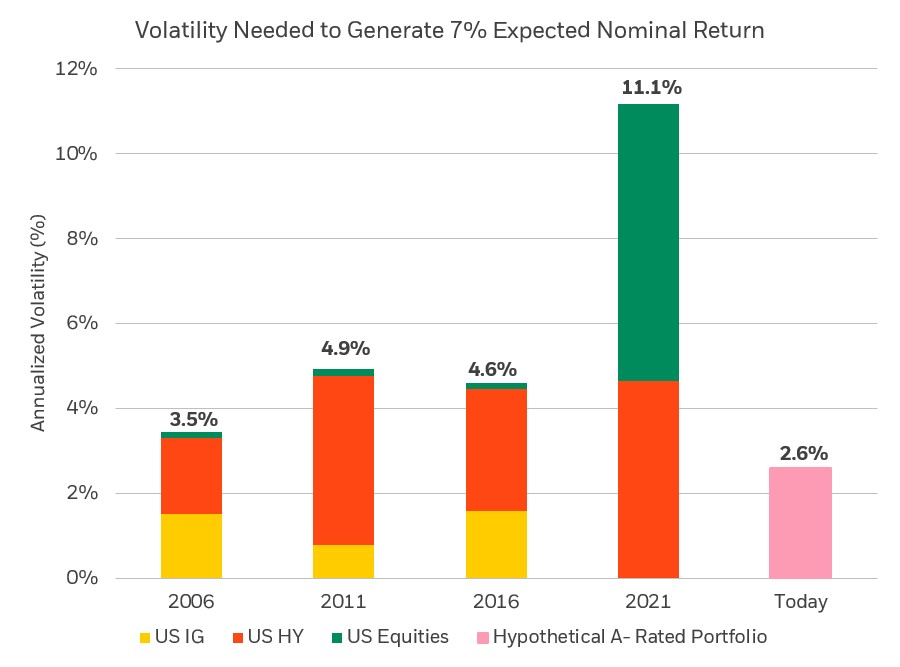
In fixed income, the math is unusually transparent: return equals carry plus price change. Carry today provides a substantial cushion against price volatility. This does not mean rates cannot move higher in the near term; they can. It means pulling the bowstring back further only increases the forward return embedded in the entry point. Real yields are at historically attractive levels, pension funding ratios are high enough to create durable demand for long-duration assets at these levels, and the volatility required to build a portfolio with a 7% return target is the lowest it has been since before the financial crisis (2.6% annualized for a hypothetical A-rated portfolio today, versus 11.1% in 2021).9
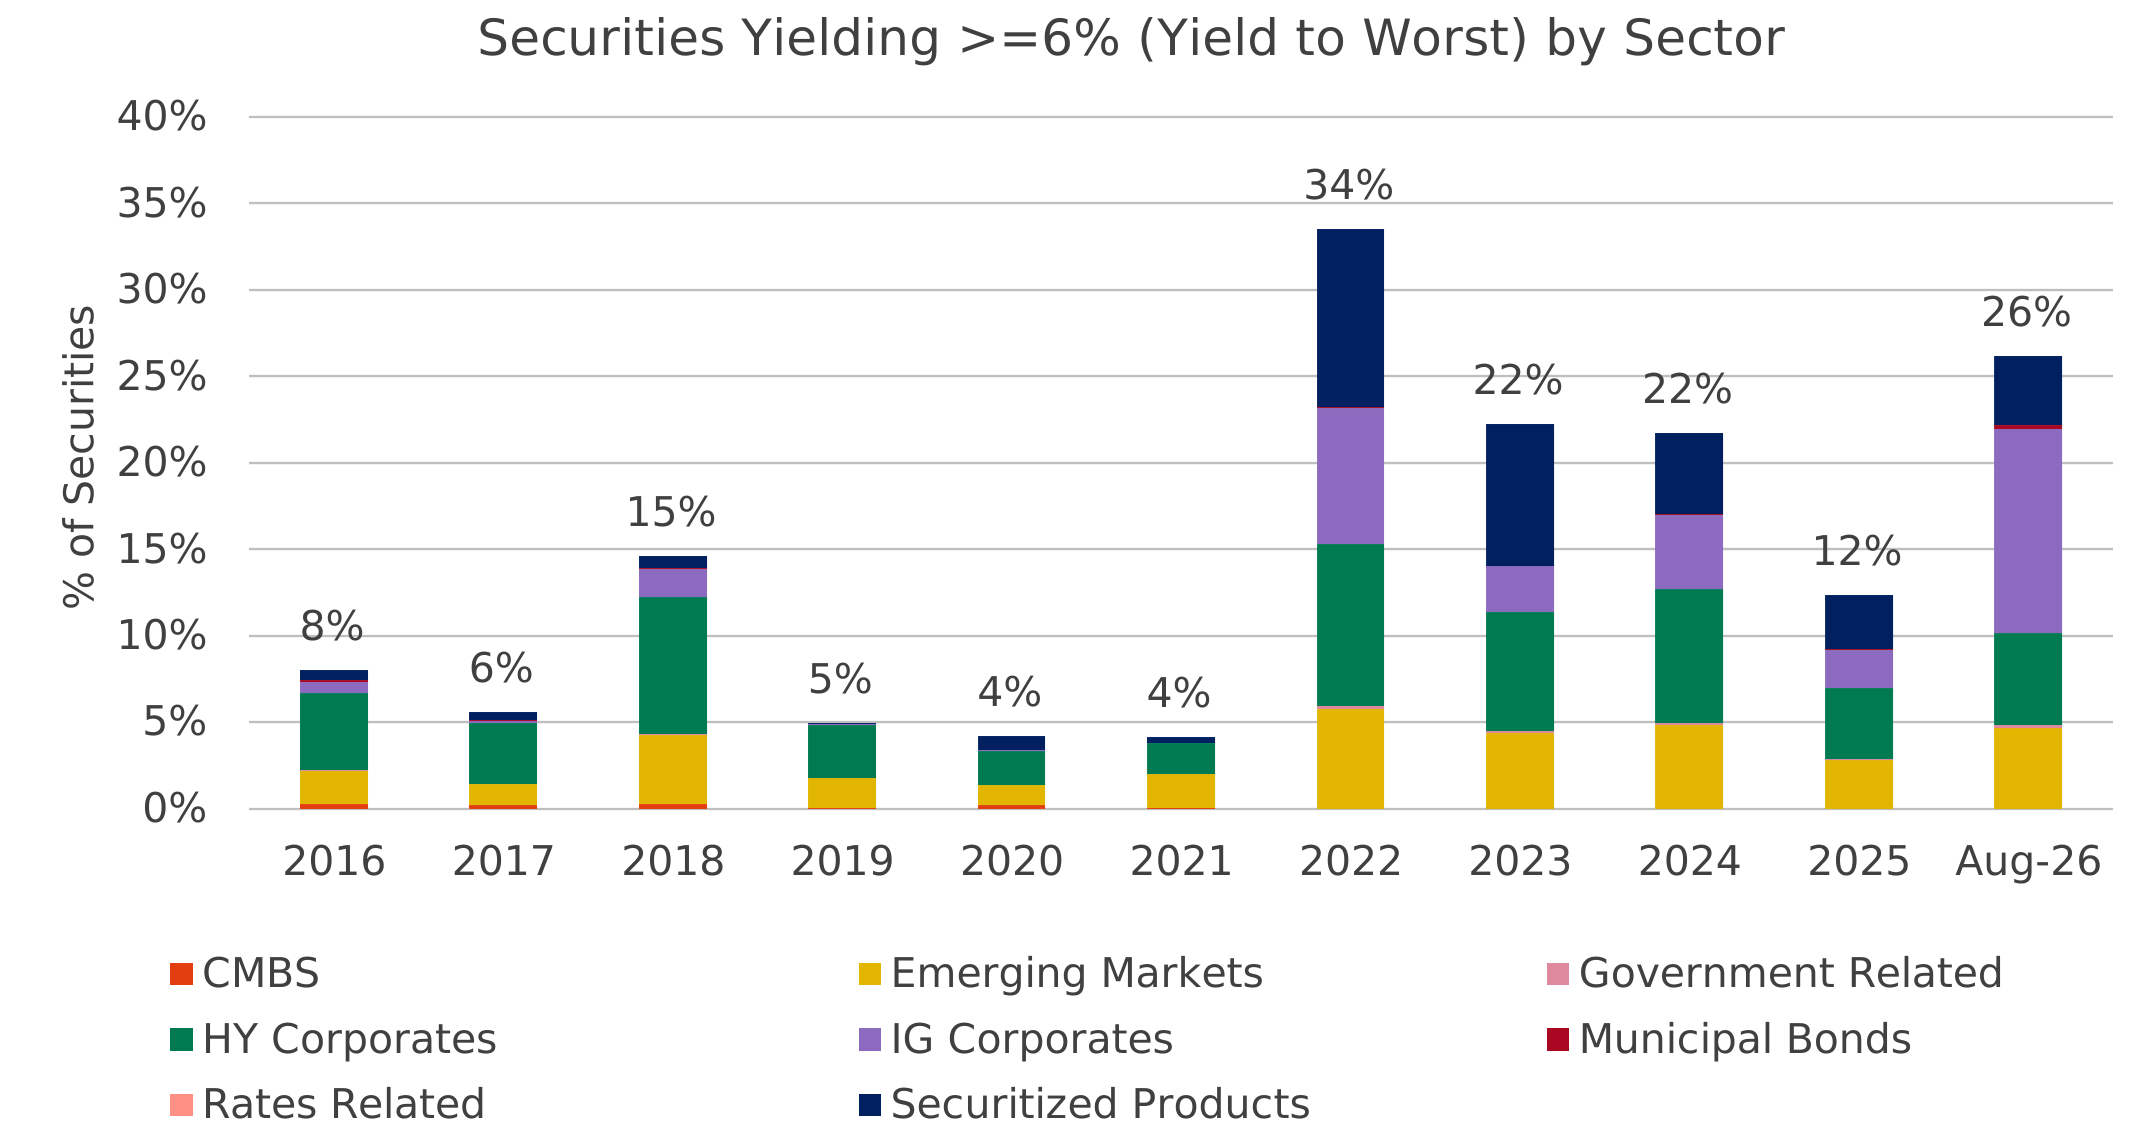
Moreover, the ability to source yields above 6% across a range of sectors, not just high yield or emerging markets, changes the calculus. Bespoke, well-structured financing assets, including data center asset-backed securities (ABS), whole-business securitizations, and private placements, offer more yield and considerably stronger structural protection than traditional credit. When yield meaningfully exceeds volatility, optimizing portfolios for the prevailing regime can be particularly powerful. Today's environment offers just that opportunity.
Source: Bloomberg, as of Sept. 11, 2026.
Equities: Earnings growth matters, but so does the entry level
For equities, the starting multiple tells us little about future returns. The R-squared between forward price-to-earnings (P/E) and one-year returns is just 0.07. Strong earnings can continue to support equity returns. The AI ecosystem still has the fundamentals to do so. Data center infrastructure and semiconductor companies show expected earnings growth above 25%, while multiples have de-rated 10 to 13 turns from their year-to-date peaks. A meaningful share of that future growth is already under contract.10 The entry point today, after the recent pullback, looks more attractive than it has in months.
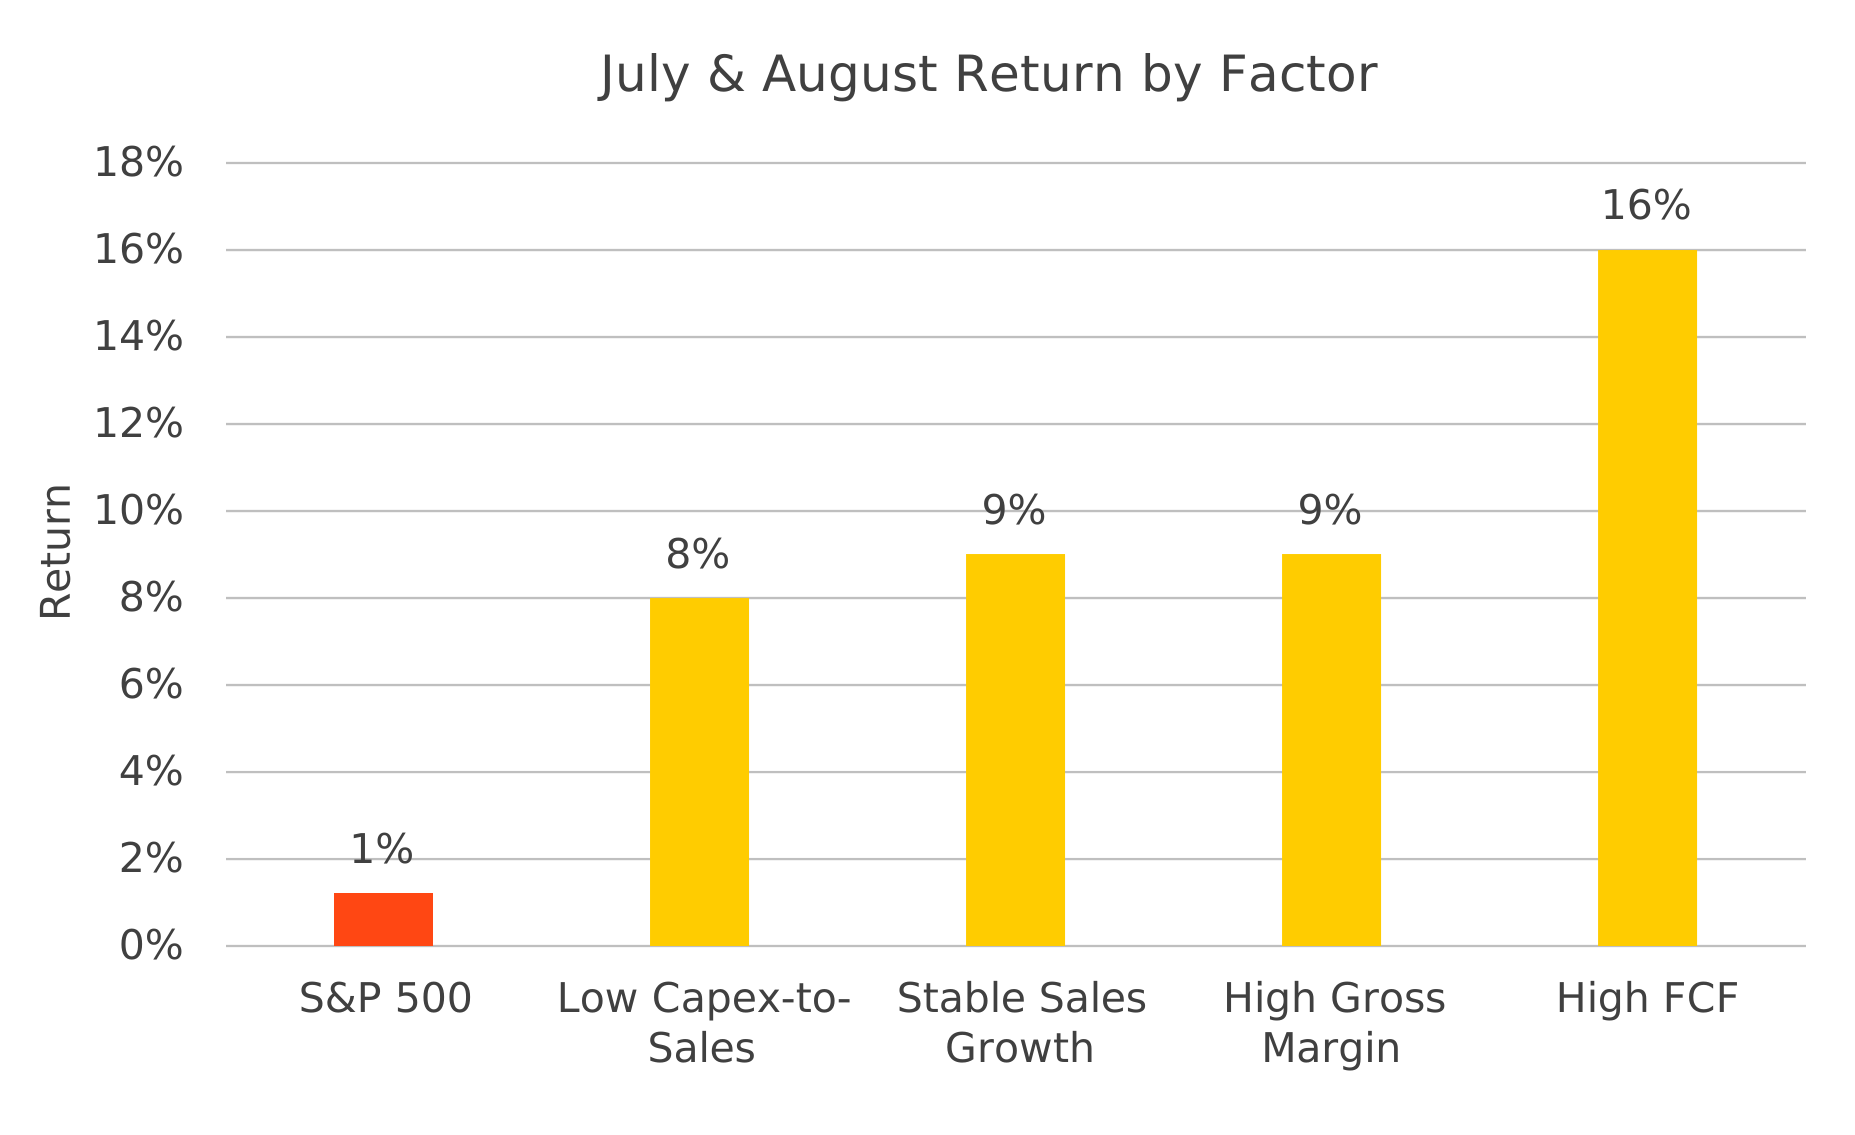
But the range of outcomes has clearly widened. From today's starting point, equities could plausibly return anywhere from -5% to +20% over the next year depending on whether earnings deliver and multiples hold or compress. With fixed income able to fund a larger share of portfolio return targets, equity risk can be spent more selectively. The trailing two months tell the story: the S&P 500 returned 1%, while stocks characterized by high free cash flow returned 16%, those with stable sales growth returned 9%, and those with low capex-to-sales returned 8%.11 Cash flow durability and capital efficiency are the filters. This is not the market to own beta for the sake of it.
Source: Citi, as Sept. 4, 2026.
U.S. government debt and fiscal risk: The elephant in the room
Before leaving the discussion on portfolio allocations, it is worth confronting a risk that underlies all markets, one that the rate increase makes more urgent. The Congressional Budget Office (CBO) baseline projects debt-to-GDP reaching approximately 120% by 2036, assuming 3.9% nominal growth and a 3.7% average cost of debt. Higher funding costs make that trajectory considerably worse: a sustained 1% increase in the cost of debt adds 8 percentage points to the terminal debt burden; a 2% increase adds 16 percentage points and implies roughly $7.5 trillion in additional net interest expense through 2036.12
Nearly half of marketable Treasury debt matures within two years, and 89% of issuance is concentrated at the front end. Higher rates feed directly into the government's interest bill.13 Refinancing that short-term debt at rates just 1 percentage point lower would generate $144 billion in annual savings, enough to fund the combined FY 2027 discretionary budgets of the Departments of Health and Human Services, Agriculture, Treasury, Labor, and Commerce.14 The arithmetic of this fiscal trajectory makes managing fixed income volatility and optimizing portfolio construction not just sensible, but urgent.
Bottom line: From explaining markets to building better portfolios
The framework is simple and powerful: the edge does not come from having more answers. It comes from asking the five structural questions that actually matter.
- What return do we need over the next three to five years, and how much of that can today's starting yield deliver without reaching for additional risk?
- With real yields at historically attractive levels, how much interest-rate risk do we actually need to own when carry alone can do so much of the work?
- In credit, where is the yield coming from, and where do leverage, refinancing, and rollover risk make the incremental spread not worth taking?
- In equities, which earnings growth is durable, cash-generative, and not already fully reflected in the entry price?
- As yields reset higher, how quickly should we add duration, and where on the curve do supply and the carry cushion justify that risk while fiscal pressures remain unresolved?
The direction of travel is clear even if the pacing is hard. When a diversified fixed income portfolio can yield more than 7%, carry less than three years of duration and maintain an average A- credit rating, the portfolio math changes materially. If inflation continues trending toward a 2% range, that income becomes even more meaningful in real terms. Equities still matter for long-term growth, but investors no longer need them to carry as much of the return burden. Built deliberately, that combination can create a portfolio that does not depend on the next payroll print, the next CPI surprise, or the next geopolitical headline..
Sources: Bloomberg, BlackRock, as of Sept. 12, 2026.
Markets will keep generating noise, headlines, and reasons to wait. But the math of starting yields, the breadth of investable debt, and the narrowing path to strong equity returns all point in the same direction: investors should focus on the right structural questions, rather than chasing the next data print. In today's markets, the edge comes from asking better questions.