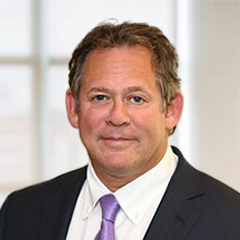
Rick Rieder, Senior Managing Director, is BlackRock's Chief Investment Officer of Global Fixed Income, Head of the Fundamental Fixed Income business and Head of the Global Allocation Investment Team.
Responsible for managing roughly $2.4 trillion in assets, Mr. Rieder is a member of BlackRock’s Global Executive Committee (GEC) and its GEC Investment Sub-Committee. He also is Chairman of the firm-wide BlackRock Investment Council.
Mr. Rieder currently serves on the Alphabet/Google Investment Advisory Committee and the UBS Research Advisory Board. He was nominated for Outstanding Portfolio Manager by Morningstar in 2021, was awarded the Global Unconstrained Fixed Income Manager of the Year for 2015 by Institutional Investor, was nominated for Fixed Income Manager of the Year by Institutional Investor for 2014 and was inducted into the Fixed Income Analysts Society Fixed Income Hall of Fame in 2013.
Mr. Rieder has served as Vice Chairman and member of the Borrowing Committee for the U.S. Treasury and member of the Federal Reserve’s Investment Advisory Committee on Financial Markets.
Before joining BlackRock in 2009, Mr. Rieder was President and Chief Executive Officer of R3 Capital Partners. From 1987 to 2008, he was with Lehman Brothers where he was head of the firm's Global Principal Strategies team, a global proprietary investment platform. He was also global head of the firm's credit businesses, Chairman of the Corporate Bond and Loan Capital Commitment Committee and a member of the Board of Trustees for the corporate pension fund. Before joining Lehman Brothers, Mr. Rieder was a credit analyst at SunTrust Banks in Atlanta.
Mr. Rieder earned a BBA degree in Finance from Emory University in 1983 and an MBA degree from The Wharton School of the University of Pennsylvania in 1987. He is a member of the board of Emory University, Emory's Goizueta Business School, and the University's Finance Committee, and is the Vice Chairman of the Investment Committee. Mr. Rieder is founder and chairman of the Goizueta Business School's BBA investment fund and community financial literacy outreach program, Graduation Generation. Mr. Rieder serves as Chairman and President of the Board of Education for North Star Academy's fourteen Charter Schools in Newark, NJ. He is on the Board of the BlackRock Foundation, the Board of Advisors for the Hospital for Special Surgery, and the Board of Big Brothers/Big Sisters of Newark and Essex County. Mr. Rieder formerly served on the Board and National Leadership Council of the Communities in Schools Educational Foundation in Atlanta, and Trustee for the U.S. Olympic Foundation. Mr. Rieder was honored at the Choose Success Awards ceremony in Atlanta in 2015 for his dedication to public education in Atlanta through CIS and Graduation Generation.