Beleggingscategorie
BLACKROCK INVESTMENT INSTITUTE
Beleggingsinformatie
Market take
Weekly video_20261005
Michel Dilmanian
Portfolio Strategist
BlackRock Investment Institute
SCRIPT
Header:
CAPITAL AT RISK. MARKETING MATERIAL.
Opening frame: What’s driving markets? Market take
Camera frame
Title slide: US dollar: surprisingly resilient
We think fundamental drivers, such as rate differentials, explain the dollar’s resilience this year, supporting our view that calls for its debasement are overdone. At the same time, we don’t think its strength means the beginning of a sustained upswing.
1: Big swings
The dollar has swung dramatically over the past 18 months. It dropped after the 'Liberation Day' tariffs, stabilised for a time, and then weakened again as investors questioned the Fed's credibility.
Now it's rebounding. The main reason? Markets have sharply repriced the path of Fed rates, pushing US two-year yields higher relative to other developed market economies.
2: A more mundane picture
To be sure, we think market expectations for as many as four hikes over the next twelve months are overdone. If investors pare back expectations for further tightening, yield differentials could narrow and weigh on the dollar. That would reinforce our broader pro-risk stance and support our EM equity overweight.
3: More than one fundamental driver
But there’s more to the story. Strong US growth, corporate earnings and AI investment have helped US equities outperform for much of this year. Case in point: Foreign investors have poured nearly $1 trillion into US assets in the 12 months through July, according to the Bureau of Economic Analysis. Our analysis also captures traditional drivers like risk sentiment and term premium.
On balance, we see little room for another sustained dollar rally. We expect the dollar to stay around current levels, if not somewhat weaker. That underscores skepticism of the debasement narrative around the dollar. If investors were losing confidence in the dollar’s long-term role, we would expect more weakness.
Outro: Here’s our Market take
The dollar’s resilience is largely explained by fundamental drivers, supporting our view that concerns about its long-term role are overdone. A stable or moderately weaker dollar would also reinforce our EM equity overweight.
Closing frame: Read details: blackrock.com/weekly-commentary
Fundamentals help explain the dollar’s resilience, supporting our view that it’s too soon to call for its demise. Yet we don’t think this portends a sustained rally.
A soft US jobs report helped cap gains in US 10-year Treasury yields. Yet the structural forces driving long-term yields remain intact.
We look to September FOMC meeting minutes for details on the central bank’s discussion underscoring its first rate hike in three years.
The US dollar has rallied over the past month, taking its gains this year to about 4% against developed-market currencies. Its resilience suggests it may be too soon to write off the dollar’s long-term role. Familiar drivers like rate differentials and risk sentiment help explain the rebound. Yet the greenback is stronger than the level suggested by our analysis. With markets pricing more Fed tightening than we think will materialise, there is limited scope for a sustained dollar bull run.
Swing dollar
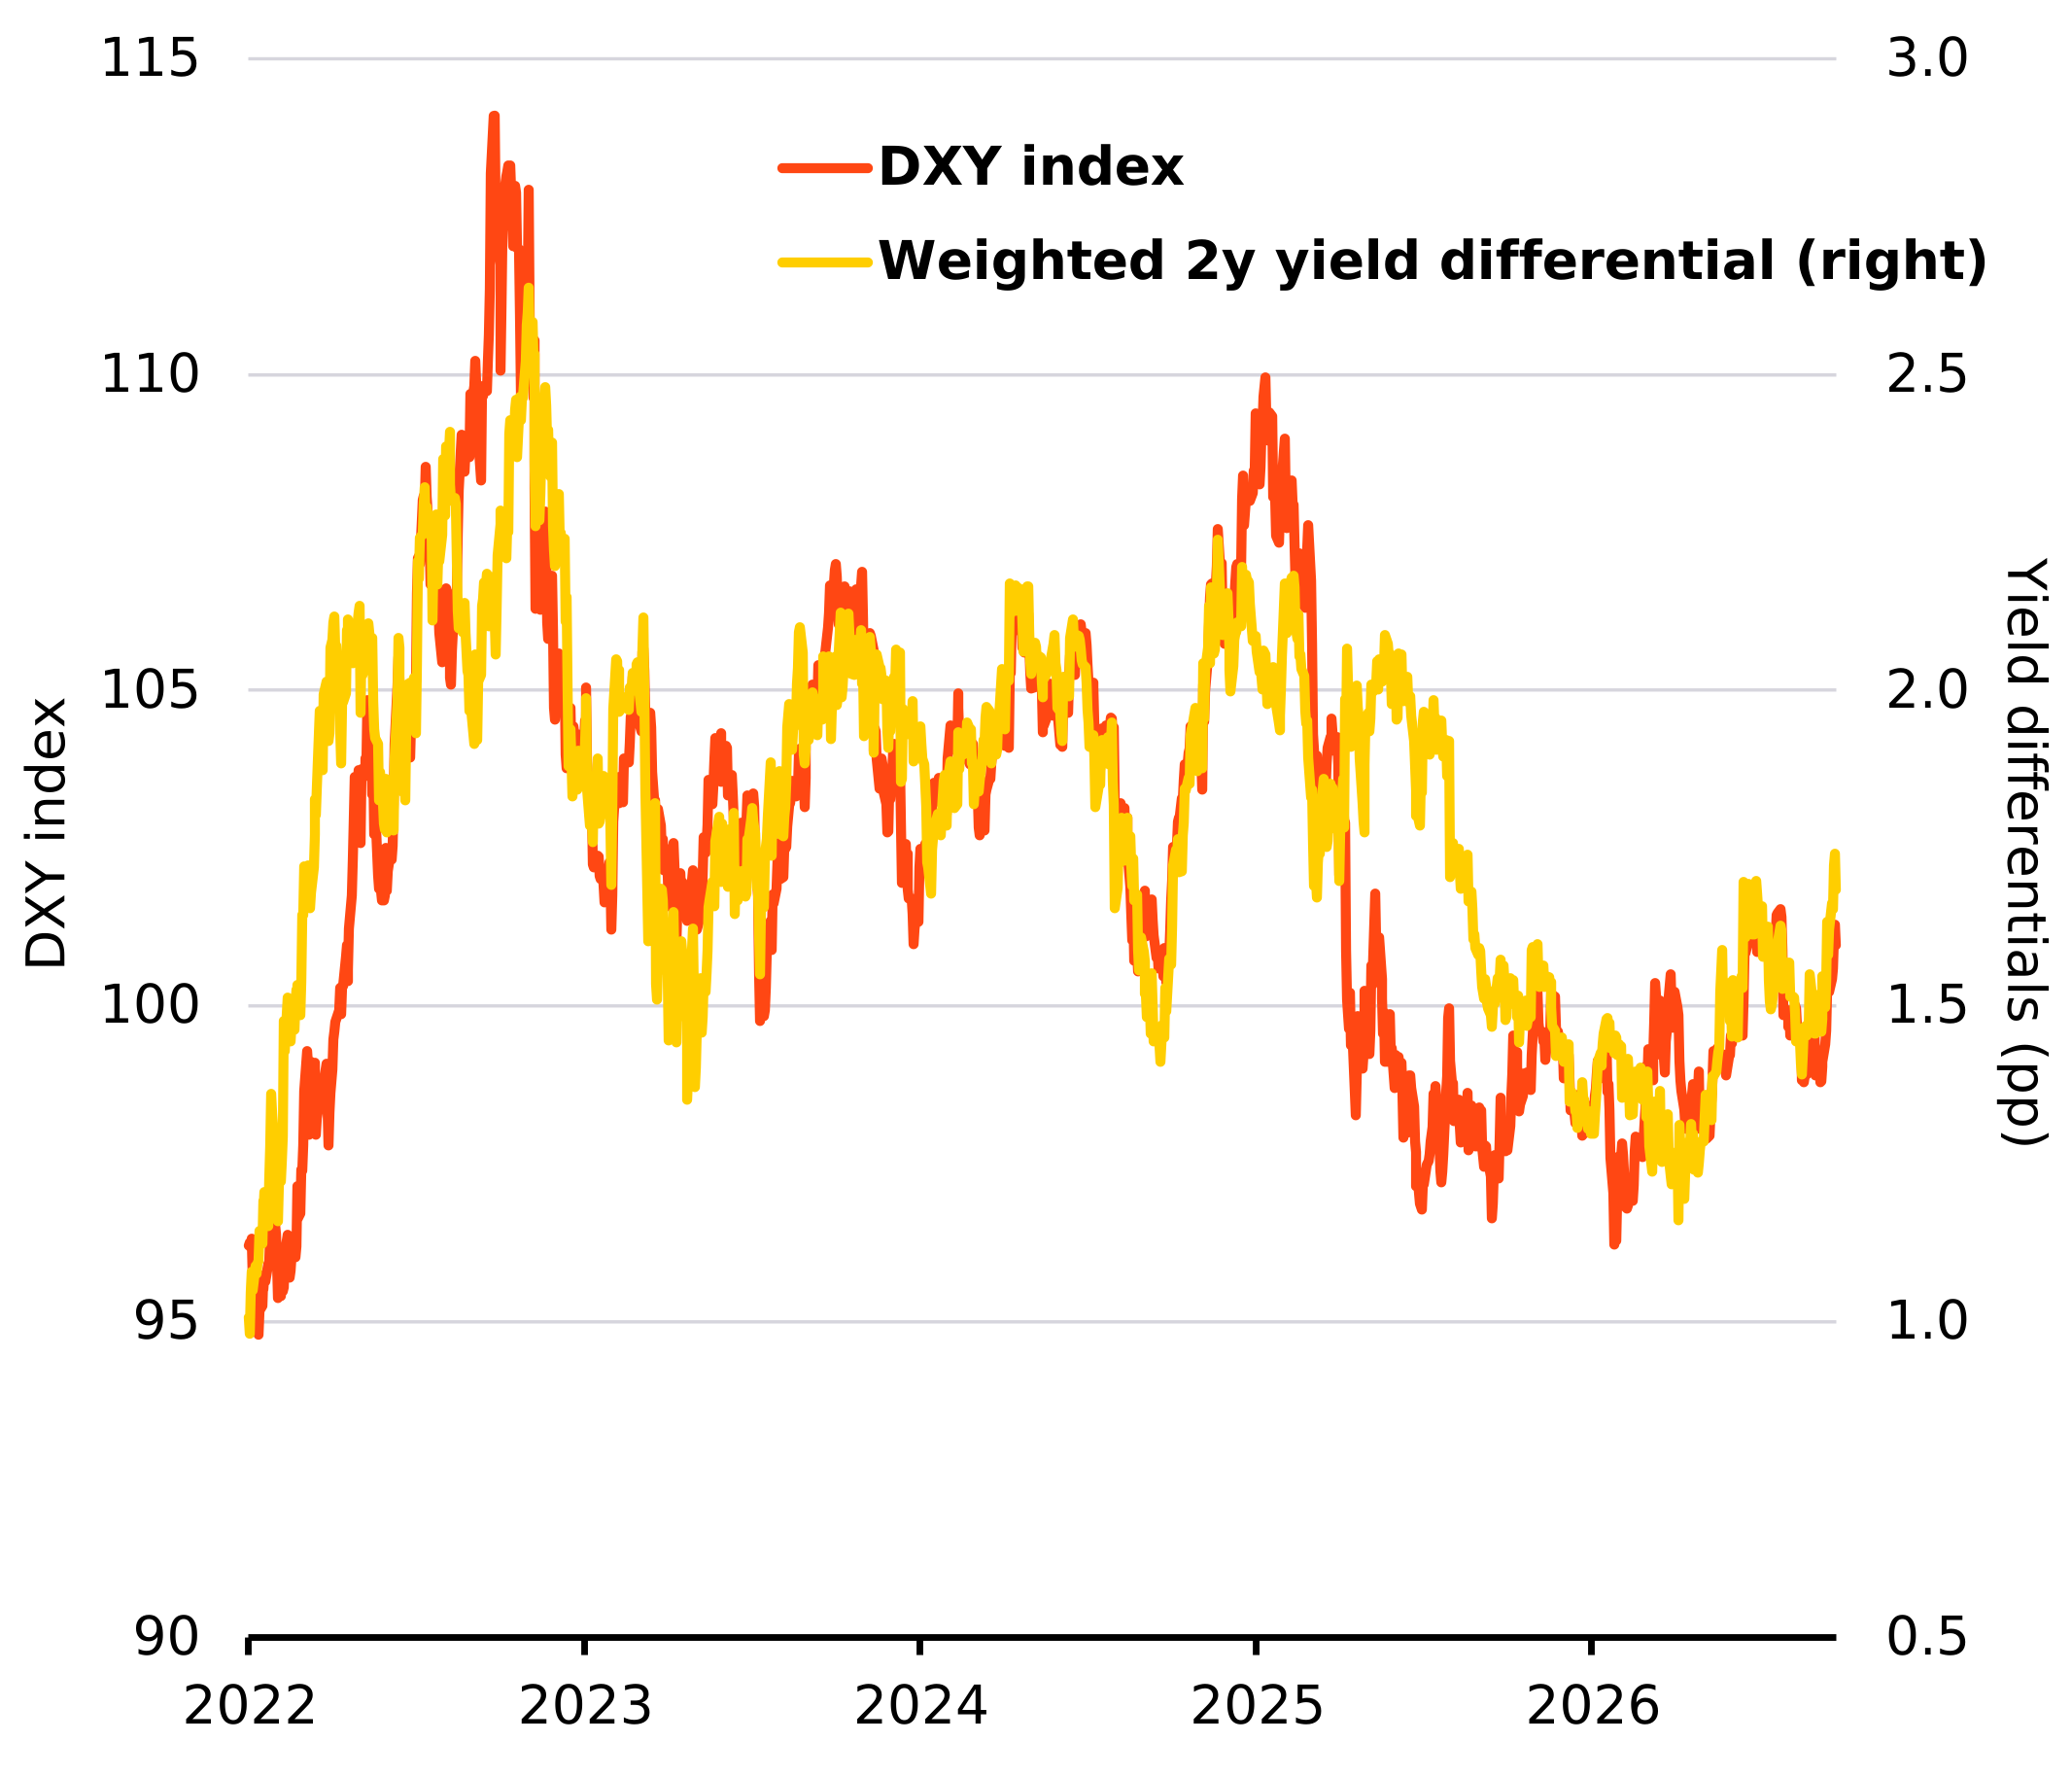
US dollar index vs. trade-weighted two-year yield differential, 2022–2026
Source: BlackRock Investment Institute, with data from LSEG Datastream, October 2026. Notes: The orange line shows the US Dollar Index (DXY). The yellow line shows the trade-weighted average US two-year yield differential versus Germany, Japan, the UK, Canada, Sweden and Switzerland (right axis), using DXY currency weights. Yield differentials are shown in percentage points.
The dollar’s journey over the past 18 months has been telling. It fell sharply after President Donald Trump’s “Liberation Day” tariff announcements fueled warnings about dollar debasement, stabilised, then weakened again this summer amid Fed credibility concerns. It has since rebounded as Fed rate expectations swung dramatically – from as many as two cuts this year to one hike already delivered and more tightening priced. The dollar has closely tracked the resulting shift in two-year yield differentials. See the chart. The DXY has now retraced most of its post-April 2 tariff decline. That supports our pushback last year against the dollar debasement narrative. Yet we don’t expect a sustained appreciation cycle. Even with Fed repricing, strong US growth and robust equity inflows, our analysis suggests the dollar is stronger than these and other fundamental drivers imply. The bar for further gains is high.
Start with the Fed rate path. The dramatic repricing has provided a powerful boost to the dollar and dollar assets this year. Markets have gone from pricing cuts at the start of the year to pricing roughly four more hikes over the next 12 months, on top of last month’s rate increase. We think that is too much. Last week’s weaker-than-expected jobs report highlights a macro backdrop that remains fluid. If expectations for further Fed tightening are pared back, the yield differentials that have helped drive the dollar’s rebound could narrow and weigh on the currency. A weaker dollar would reinforce our broader risk-on stance and create a more supportive backdrop for our EM equity overweight.
Next come capital flows. Strong US growth, corporate earnings and AI investment have helped US equities outperform since the start of the war in Iran, drawing global capital into dollar assets. Foreign investors poured nearly $1 trillion into US equities and investment fund shares in the 12 months to July, including a record $426 billion in the second quarter alone, according to the Bureau of Economic Analysis. We expect that support to persist as earnings growth stays robust. US equity outperformance should provide a partial offset if Fed repricing narrows yield differentials and weighs on the dollar.
Our analysis also captures traditional drivers, including risk sentiment and term premium. The latter has eased slightly after briefly rising this summer, as the Fed’s September hike helped restore central bank credibility. On balance, we see little room for another sustained dollar upswing. Instead, we see the currency staying around current levels, if not somewhat weaker. That is hard to square with the structural debasement narrative that started emerging last year: if investors were losing confidence in the dollar’s long-term role, we would expect a bigger deviation from the dollar’s fundamental drivers. That doesn’t mean the risks have disappeared. The fiscal backdrop remains challenging, with a $1.9 trillion deficit and public debt near 101% of GDP. While not a driver of the dollar today, these risks could return to the fore.
The dollar’s resilience shows its moves are still largely explained by fundamental drivers rather than concerns about its long-term role. A stable or moderately weaker dollar would also reinforce our EM equity overweight.
The global bond selloff deepened last week, with US 10-year Treasury yields climbing to 5.34%, their highest level since 2002. A softer-than-expected jobs report added to the volatility as investor expectations for Fed tightening whipsawed. We see a consistent story: shifts in Fed expectations can influence rate moves in the near term, but they do not alter the structural forces driving long-term yields, including the intensifying competition for capital we have long described.
We look to September FOMC meeting minutes in a light macroeconomic data week. After the Fed raised interest rates for the first time in three years, we’re keen to see how hawkish the discussion surrounding the decision was among committee members. We also eye preliminary consumer sentiment data from the University of Michigan, after the index fell to its second-lowest reading ever at the end of September.

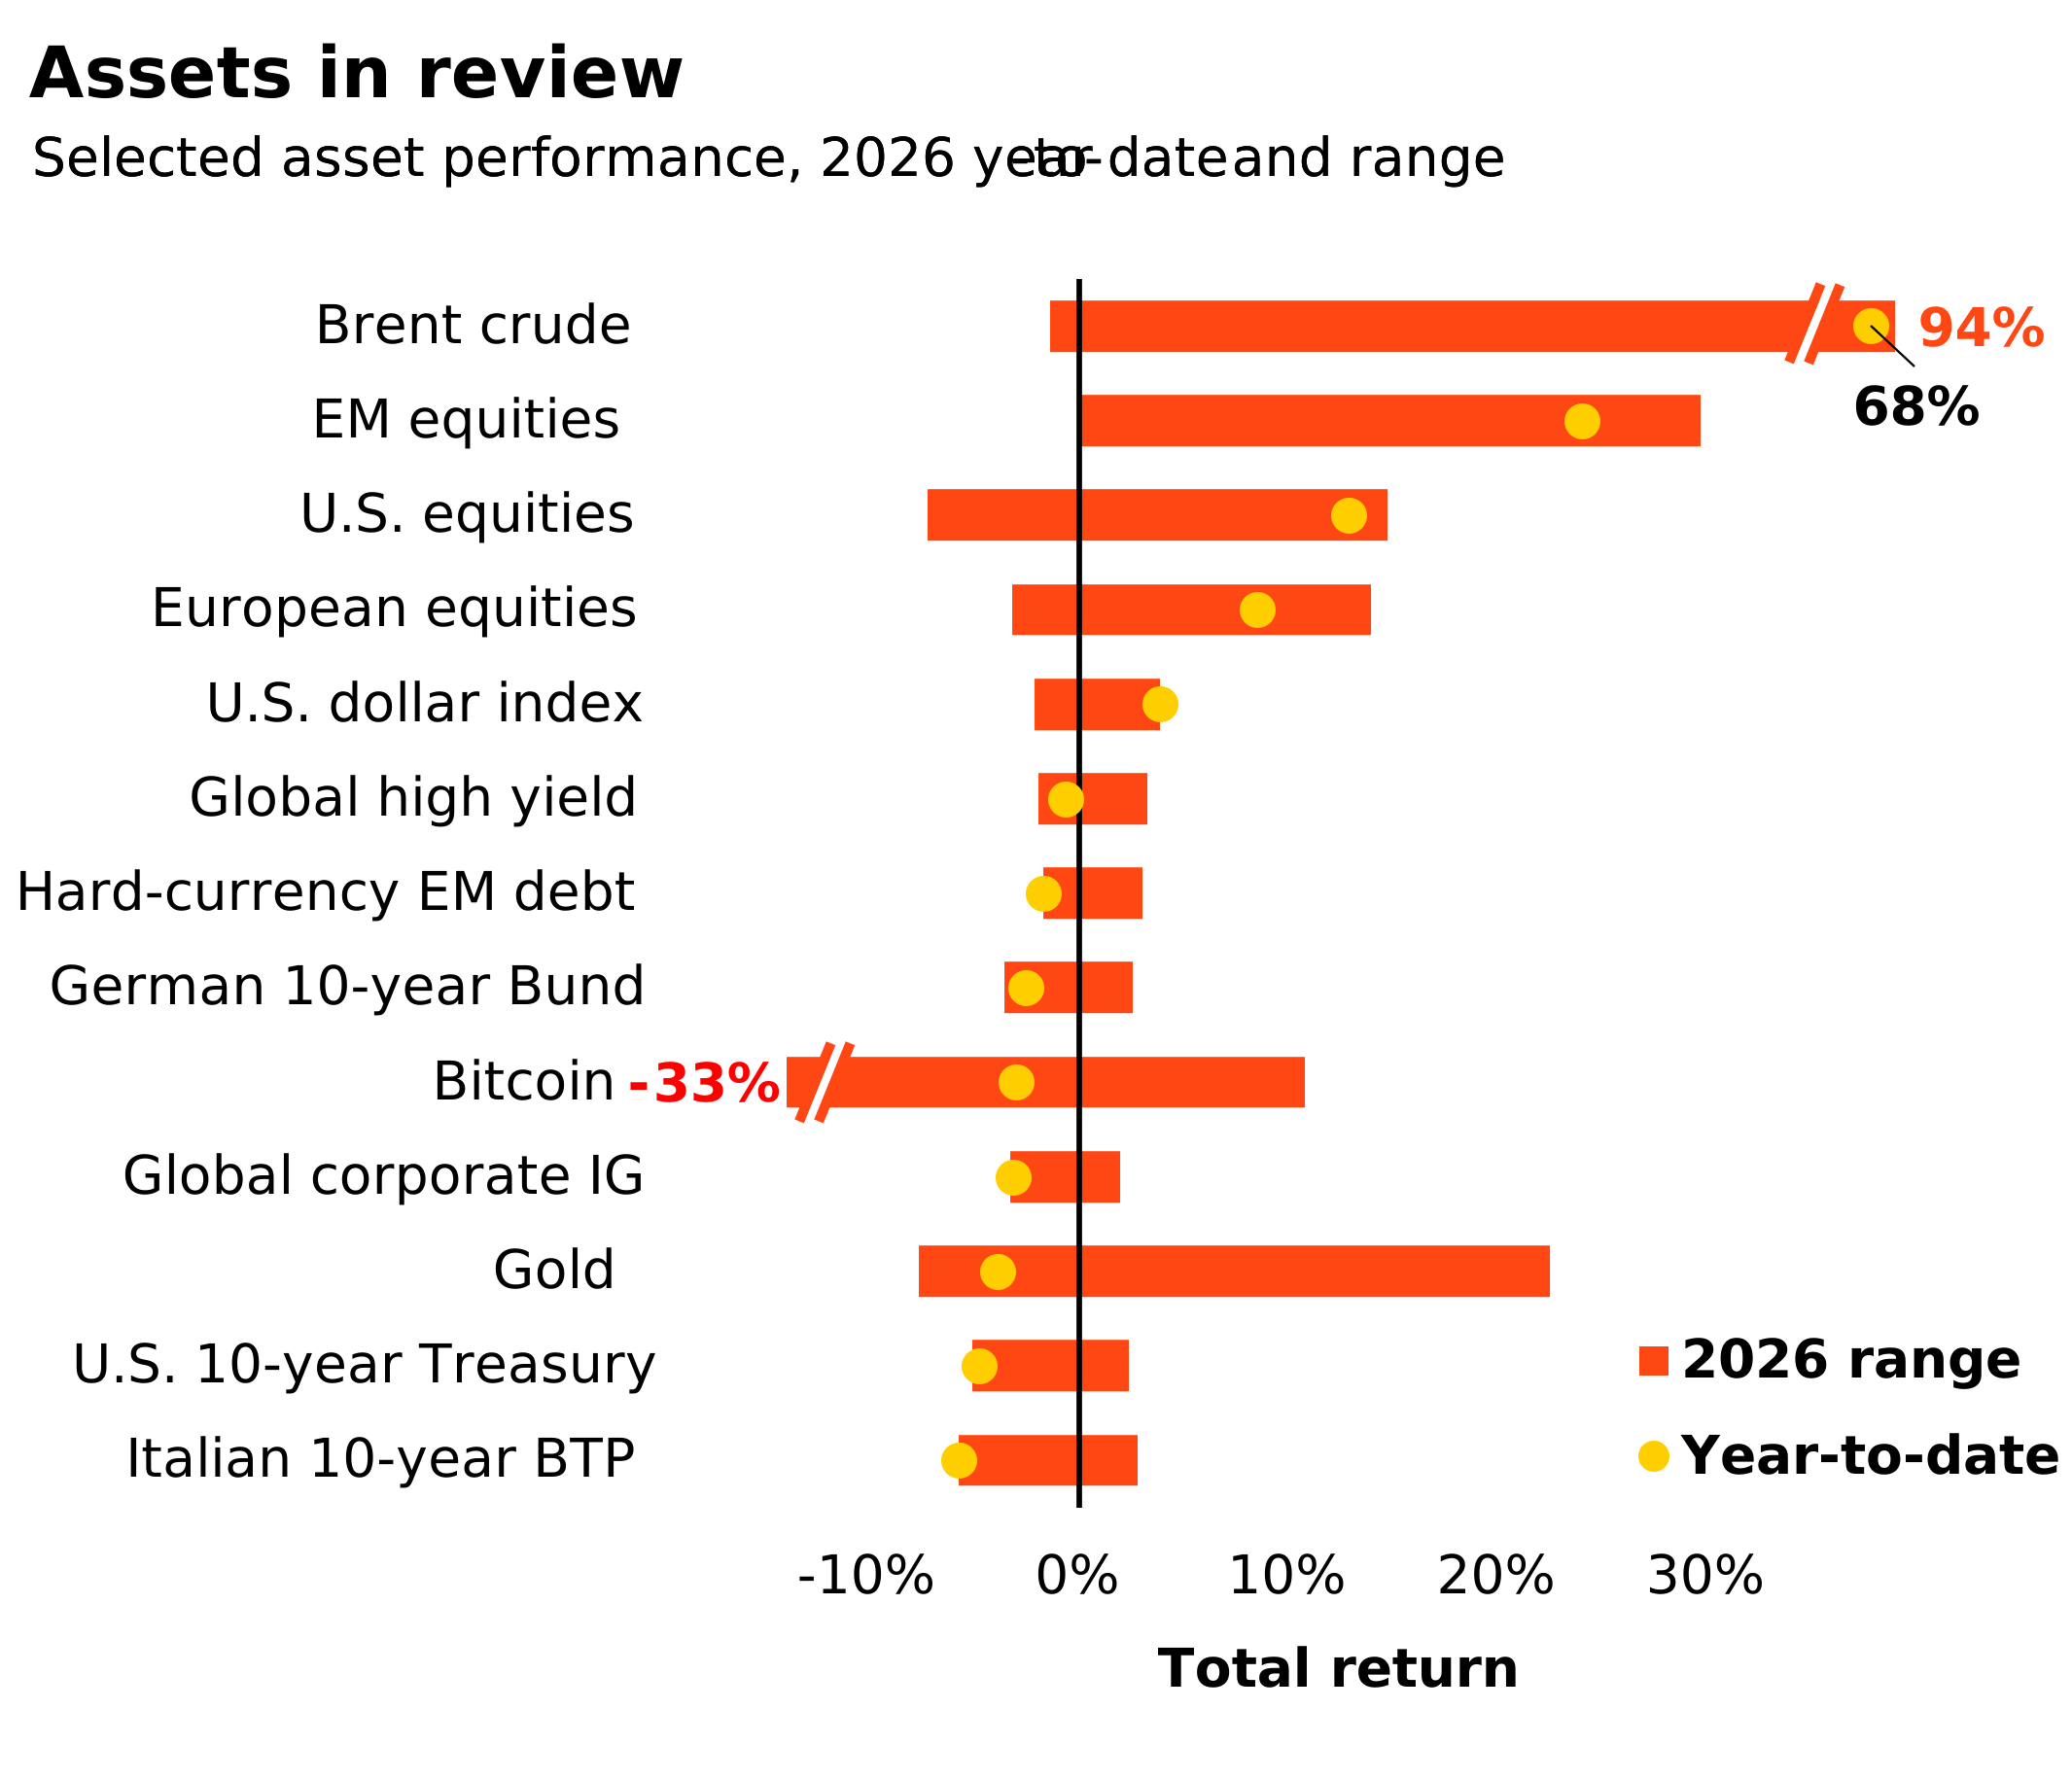
Past performance is not a reliable indicator of current or future results. Indexes are unmanaged and do not account for fees. It is not possible to invest directly in an index. Sources: BlackRock Investment Institute, with data from LSEG Datastream as of October 1, 2026. Notes: The two ends of the bars show the lowest and highest res at any point year to date, and the dots represent current year-to-date res. Emerging market (EM), high yield and global corporate investment grade (IG) res are denominated in US dollars, and the rest in local currencies. Indexes or prices used are: spot Brent crude, ICE US Dollar Index (DXY), spot gold, spot bitcoin, MSCI Emerging Markets Index, MSCI Europe Index, LSEG Datastream 10-year benchmark government bond index (US, Germany and Italy), Bloomberg Global High Yield Index, J.P. Morgan EMBI Index, Bloomberg Global Corporate Index and MSCI USA Index.
Global composite/services PMI final
US international trade; EU & UK construction PMI
FOMC minutes
UMich preliminary consumer sentiment
Read our past weekly commentaries here.
Since we launched our mega forces framework it has become clearer how their intersection shapes almost all our investment views and opens up alpha opportunities. They cut across asset class labels, spurring a rethink of portfolio construction. Investors need to be deliberate about the economic or thematic exposures they own, the vehicles they use to implement them and their investment horizons.
Our highest conviction views, October 2026
| Driver | What we think | Portfolio expression |
|---|---|---|
| Growth and AI scarcity | The AI buildout is speeding up, making bottlenecks binding. | Overweight US and EM equities; focus on AI bottleneck opportunities: power, chips and data centers. |
| Duration and diversification | Long bonds carry high rate sensitivity and are less reliable diversifiers. | Prefer short- and medium-term government bonds over long bonds for income. |
| Credit spreads and liquidity | Selectivity is crucial amid tight spreads and uneven fundamentals. | Credit with clear cash flows, lender protections and recovery value; higher-rated high yield. |
| Inflation and scarcity | Scarcity, secure supply and power demand carry inflation risks. | Infrastructure, energy bottlenecks, EM local debt and real-asset-linked exposures. |
| Alpha opportunity | Macro outcomes matter again in the new regime. | Macro hedge funds, venture capital, market-neutral strategies, and selected private credit and non-US alpha. |
Note: Views are from a US dollar perspective, October 2026. This material represents an assessment of the market environment at a specific time and is not intended to be a forecast of future events or a guarantee of future results. This information should not be relied upon by the reader as research or investment advice regarding any particular funds, strategy or security.
Six- to 12-month tactical positioning, October 2026
This shows the implementation of our key investment views from the previous page through an asset class lens.
| Asset | Tactical view | Commentary | ||||
|---|---|---|---|---|---|---|
| Equities | ||||||
| United States | We are overweight. Strong corporate earnings, fueled by the AI buildout and a favorable macro backdrop, are outpacing higher interest rate expectations. | |||||
| Europe | We are neutral. We would need to see more business-friendly policy and deeper capital markets for Europe to outperform. We favor financials, infrastructure, and industrials. | |||||
| UK | We are neutral. Valuations remain attractive relative to the US, but we see few near-term catalysts to trigger a shift. | |||||
| Japan | We are neutral. Strong corporate balance sheets and governance reforms remain supportive. We prefer targeted exposures to physical AI and the buildout’s bottlenecks. | |||||
| Emerging markets (EM) | We are overweight. Strong earnings and cheaper valuations create opportunities. We particularly like different expressions of the AI scarcity theme across Asia and Latin America. | |||||
| China | We are neutral. We see opportunities in physical AI. Cheap, open-source AI could drive adoption, but that doesn’t necessarily translate into AI-provider profitability. | |||||
| Fixed income | ||||||
| Short US Treasuries | We are neutral. We prefer short- and medium-term Treasuries, given the attractive risk-adjusted income on offer. | |||||
| Long US Treasuries | We are underweight. We see investors wanting more compensation for holding long-term bonds amid persistent inflation and high debt loads. Long-duration bonds also are a less reliable portfolio diversifier in the new regime. | |||||
| Global inflation-linked bonds | We are neutral. We see inflation settling above pre-pandemic levels, but markets may not price this in the near term as economic growth could slow. | |||||
| Euro area government bonds | We are neutral short- and medium-term bonds. Current ECB rate pricing looks fairly valued given the balance of risks. Higher energy prices could push rates higher. We prefer to deploy risk elsewhere. | |||||
| UK Gilts | We are neutral. We expect periods of elevated volatility given political uncertainty, longer-term bonds making up a larger market share, and buyers becoming more price-sensitive. | |||||
| Japanese government bonds | We are underweight. Rate hikes, higher global term premium and heavy bond issuance will likely drive yields up further. | |||||
| China government bonds | We are neutral. China bonds offer stability and diversification but developed market yields are higher. A shift in investor sentiment toward equities limits upside. | |||||
| US agency MBS | We are overweight. Agency MBS offer higher income than Treasuries with similar risk and may offer more diversification amid fiscal and inflationary pressures. | |||||
| Short-term IG credit | We are neutral. Spreads are tight due to corporate strength; they could widen if issuance increases or risk appetite shifts. | |||||
| Long-term IG credit | We are underweight. We prefer short-term bonds less exposed to interest rate risk over long-term bonds. | |||||
| Global high yield | We are neutral. High yield offers attractive income. We prefer higher-rated US and European high yield over investment grade and see dispersion of returns increasing. | |||||
| Asia credit | We are neutral. Overall yields are attractive and fundamentals are solid, but spreads are tight. | |||||
| Emerging hard currency | We are neutral. Fundamentals have improved, but we see a more attractive risk-reward profile in EM local debt. | |||||
| Emerging local currency | We are overweight. We like the yield relative to its volatility and improving fundamentals. | |||||
Past performance is not a reliable indicator of current or future results. It is not possible to invest directly in an index. Note: Views are from a US dollar perspective. This material represents an assessment of the market environment at a specific time and is not intended to be a forecast or guarantee of future results. This information should not be relied upon as investment advice regarding any particular fund, strategy or security.
Six to 12-month tactical views on selected assets vs. broad global asset classes by level of conviction, October 2026
We have lengthened our tactical investment horizon back to six to 12 months. The table below reflects this and, importantly, leaves aside the opportunity for alpha, or the potential to generate above-benchmark returns – especially at a time of heightened volatility.
| Asset | Tactical view | Commentary | ||
|---|---|---|---|---|
| Equities | ||||
| Europe ex UK | We are neutral. We would need to see more business-friendly policy and deeper capital markets for Europe to outperform and to justify a broad overweight. We stay selective, favoring financials, infrastructure, industrials, materials and healthcare. | |||
| Germany | We are neutral. Higher spending on defense and infrastructure support the corporate sector. Valuations are not stretched but neither compelling and expected earnings growth lags other countries. Light positioning means potential easing in geopolitical tensions and AI lifting industrials-driven earnings could create opportunities. | |||
| France | We are neutral. Strong expected earnings growth and global revenue exposure support French corporates. Valuations are less compelling, albeit not stretched versus euro area peers. Persistent political uncertainty leaves the overall risk reward balanced. | |||
| Italy | We are neutral. Earnings growth and momentum are strong, boosted by the significant exposure to financials, utilities and energy. Valuations are still at discount vs. peers, but not as much as in previous years. Political risk is currently low but likely to pick up ahead of 2027 elections. | |||
| Spain | We are overweight. Valuations remain attractive vs. peers even if relative earnings momentum has slowed. Strong domestic demand growth and exposure to fast-growing areas like Latin America support Spanish stocks. Financials, utilities and infrastructure-linked stocks would benefit from Europe’s push towards autonomy. | |||
| Netherlands | We are neutral. Earnings revisions in the IT sector, a large sector in the Dutch stock market is offset by other sectors seeing less favorable valuations and a weaker earnings outlook than European peers. | |||
| Switzerland | We are neutral. Valuations have improved, from stretched levels, but the earnings outlook is weaker than other European markets. If global risk appetite stays strong, the index’s tilt to stable, less volatile sectors may weigh on performance. | |||
| UK | We are neutral. Valuations remain attractive relative to the US, but we see few near-term catalysts to trigger a shift. | |||
| Fixed income | ||||
| Euro area government bonds | We are neutral short- and medium-term bonds. Current ECB rate pricing looks fairly valued given the balance of risks. Higher energy prices could push rates higher. We prefer to deploy risk elsewhere. | |||
| German bunds | We are neutral Bunds. Current ECB rate pricing looks more fairly valued given the balance of risks. Fiscal stimulus and increased bond issuance exert upward pressure on yields, alongside inflation risks amid lingering geopolitical tensions. | |||
| French OATs | We are neutral. Elevated political uncertainty, high budget deficits and slow structural reforms could stoke volatility, but these risks already seem priced into OATs and we don’t expect a material worsening from here. | |||
| Italian BTPs | We are neutral. The spread over German bunds looks tight given Italy’s large budget deficits and growing public debt. Domestic factors remain supportive, with growth holding up relative to the rest of the euro area and local demand for BTPs solid at current yield levels. Domestic disapproval would likely prevent defense spending from reaching fiscally unstable levels. Political uncertainty is likely to increase ahead of next year’s elections. | |||
| UK gilts | We are neutral. We expect periods of elevated volatility given political uncertainty, longer-term bonds making up a larger market share, and buyers becoming more price-sensitive. | |||
| Swiss government bonds | We are neutral. The SNB seems comfortable with its medium-term inflation outlook and its current policy stance. Market pricing is broadly in line with SNB messaging. | |||
| European inflation-protected securities | We are neutral. We see higher medium-term inflation, but inflation expectations are firmly anchored. Cooling inflation and uncertain growth may matter more near term. | |||
| European investment grade | European investment grade is supported by healthy corporate sector balance sheets, contained default rates and the persistently strong demand for durable income from European households. We prefer European investment grade over the US. | |||
| European high yield | We are overweight. While spreads are low, the income potential remains attractive. Defaults are contained and high yield is of higher quality and less sensitive to interest rate swings compared with the US. | |||
Past performance is not a reliable indicator of current or future results. It is not possible to invest directly in an index. Note: Views are from a euro perspective, October 2026. This material represents an assessment of the market environment at a specific time and is not intended to be a forecast or guarantee of future results. This information should not be relied upon as investment advice regarding any particular fund, strategy or security.
Beleggen gaat altijd gepaard met een zekere mate van risico. In het verleden behaalde resultaten bieden geen garantie voor de toekomst. De waarde van uw beleggingen kan sterk schommelen als een gevolg van het beleggingsbeleid en het is niet zeker dat u uw oorspronkelijke inleg terug ontvangt. De waarde van de beleggingen die blootgesteld zijn aan vreemde valuta kan worden beïnvloed door valutaschommelingen.
Bronnen: Bloomberg, tenzij anders aangegeven
DIT MATERIAAL IS BEDOELD VOOR VERSPREIDING ONDER PROFESSIONELE CLIËNTEN EN ER MAG NIET OP WORDEN VERTROUWD DOOR ANDERE PERSONEN.
De hier geuite visies en meningen vormen geen beleggingsadvies of andersoortige aanbeveling en kunnen aan verandering onderhevig zijn. Ze weerspiegelen niet altijd de gezichtspunten van een bepaalde onderneming binnen de BlackRock Group of van een afdeling daarvan en de juistheid ervan kan niet worden verzekerd.
Uitgegeven in de EER door BlackRock (Netherlands) B.V.: Amstelplein 1, 1096 HA, Amsterdam, Tel.: 020 - 549 5200, Handelsregister nr. 17068311. Raadpleeg de website voor meer informatie: www.blackrock.com. Voor uw bescherming worden telefoongesprekken gewoonlijk opgenomen. BlackRock is een handelsnaam van BlackRock (Netherlands) B.V.