Why Japan matters for U.S. bond investors
Competition for capital is intensifying, and surging yields in Japan add another pressure: they could draw some capital home and dent U.S. Treasury demand.
The 10-year JGB yield briefly topped 3% for the first time since 1996, while the yen weakened to ¥160 per dollar before rallying on intervention speculation.
U.S. inflation data take center stage this week. Sticky price pressures could reinforce the global rise in yields we see playing out in Japan.
Japan has become a key focus in the global rate reset as competition for capital intensifies. JGB yields are surging just as persistent underlying inflation and yen weakness are putting pressure on the Bank of Japan to raise rates faster. That matters globally. Higher domestic yields could draw capital home, weighing on demand for U.S. debt at a time of rising global borrowing needs. Japan adds another channel that could amplify the rate reset through shifting capital flows.
Home advantage?
Ten-year government bond yields, 2020-2026
The figure shown relates to past performance. Past performance is not a reliable indicator of current or future results. Source: BlackRock Investment Institute with data from Bloomberg, September 2026. Note: Bloomberg’s estimate of a three-month USD-JPY hedging cost is subtracted from the U.S. Treasury to derive the yen-hedged U.S. Treasury yield. Actual realised hedging costs may vary over time.
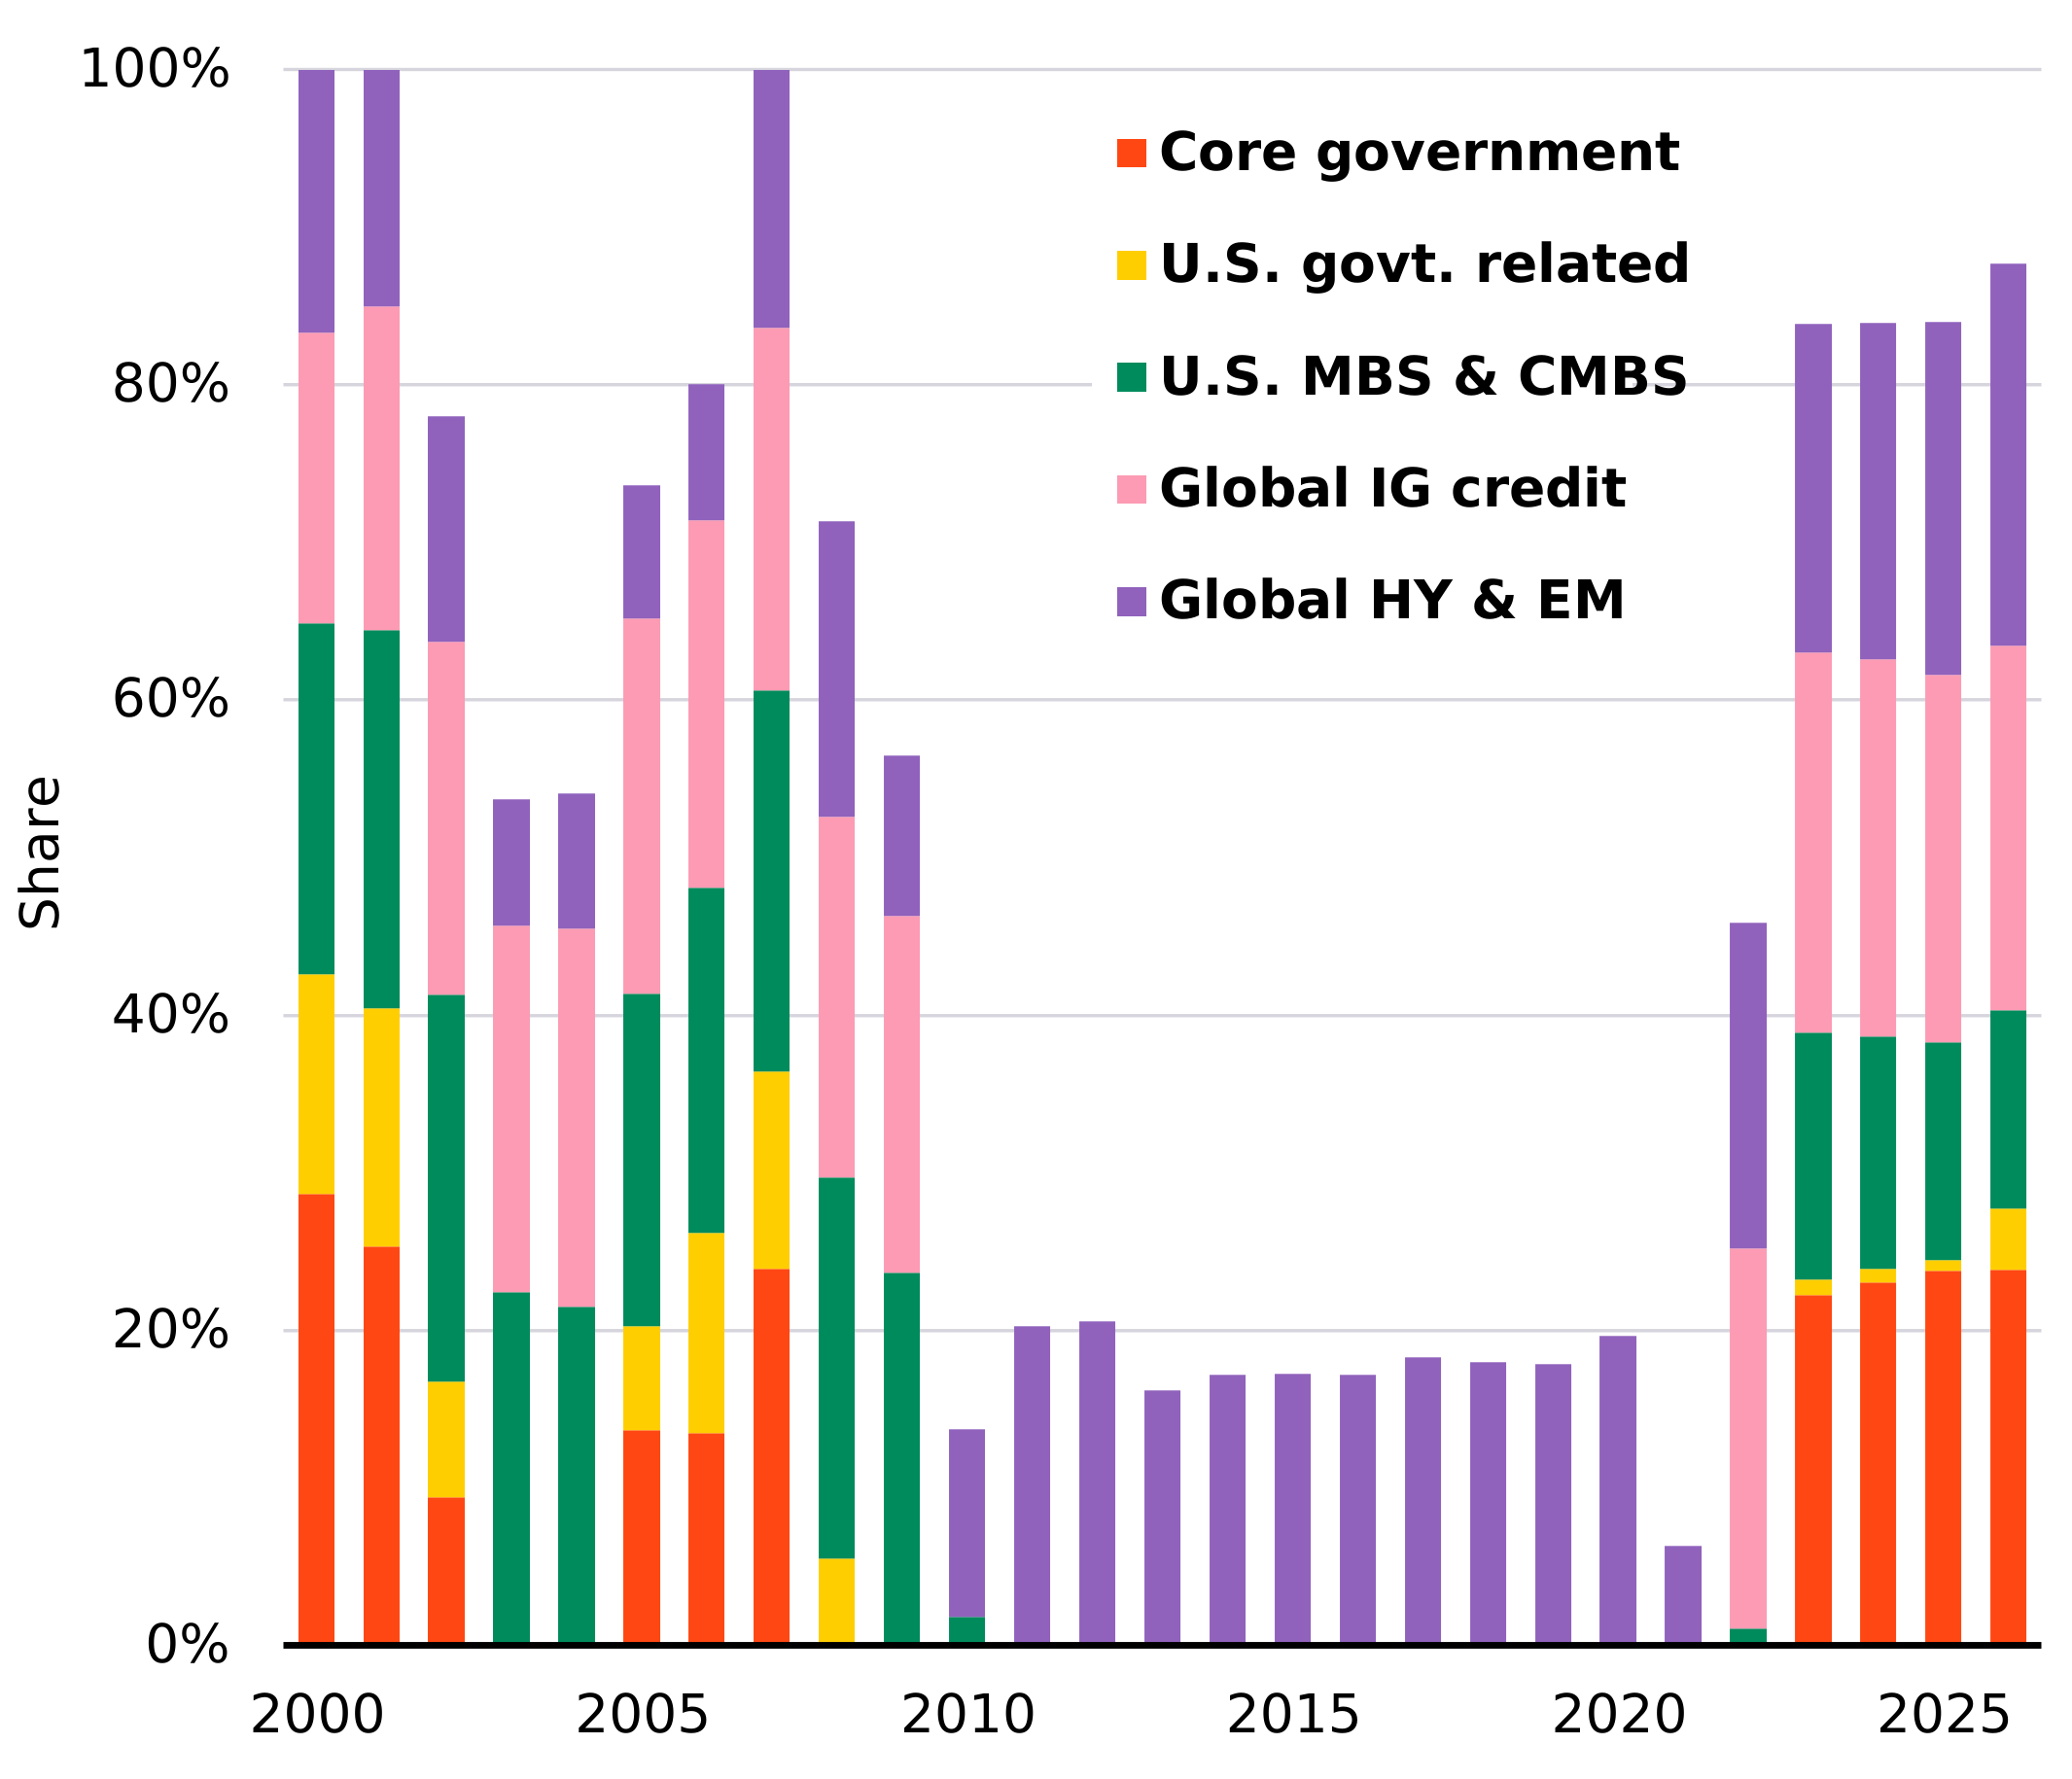
A Japanese investor can now earn about 3% on a 10-year Japanese government bond versus 2% on a 10-year Treasury after hedging back into yen using rolling three-month FX forwards. See the chart. Japan now offers a meaningful risk-free yield: the 10-year JGB yield is up roughly 90 basis points this year and briefly topped 3%, while the 30-year has hit a record 4.18%. The economic backdrop warrants tighter policy as underlying inflation persists and wages rise. Yet more expansionary fiscal policy and government debt of more than twice GDP make higher rates costly. Keeping policy too loose has weighed on the yen, which fell to ¥160 per dollar last week before rallying on speculation of further intervention. Moving faster adds to fiscal pressure. With markets fully pricing a BoJ hike this month, that tension puts fiscal-dominance risk increasingly in focus.
A faster BoJ hiking cycle would reverberate well beyond Japan. Decades of ultra-low domestic yields pushed Japanese investors overseas for income, making the country a major exporter of capital. That calculation is changing. Japan still holds roughly $1.1 trillion of U.S. Treasuries. For scale, an illustrative 5% shift would amount to $55 billion – equivalent to roughly a quarter of the increase in total foreign Treasury holdings over the past year and about 7% of the Treasury’s expected net borrowing this quarter. That would be meaningful at the margin even without a large-scale repatriation wave. This matters as governments and companies compete more intensely for a finite pool of capital.
Spillover risks
The spillover risks are real. A weaker yen can add upward pressure to U.S. yields if Japanese authorities decide to sell foreign assets, including Treasuries, to support the currency. That helps explain why the U.S. joined last month’s yen-buying intervention – the first coordinated operation with Japan since 1998. Yet the yen weakened back through ¥160 per dollar last week before rallying on speculation of further intervention and faster BoJ tightening. The risk is a feedback loop across bond markets: higher U.S. rates could weaken the yen and pressure the BoJ to move faster, while higher Japanese rates could draw more capital home, weakening demand for Treasuries and pushing U.S. borrowing costs higher.
Japan has been one of our highest-conviction regional equity calls for years, and we still prefer its equities to its government bonds as the country shifts to a higher-inflation, higher-rate environment. We remain underweight JGBs as rising yields add to global competition for capital. We are neutral on Japanese equities after closing our overweight earlier this year as we dialed down risk amid the Middle East conflict and took profits after strong performance. Yet we still see opportunities beneath the index. For example, a steeper yield curve can boost profit margins for Japanese financials, while corporate reform, rising capital spending and the AI buildout support selected companies. More broadly, higher rates are not uniformly bearish for risk assets: we favor companies with the earnings and cash flows to outrun a higher cost of capital.
Our bottom line
Japan’s rate reset matters beyond its borders: shifting capital flows could add to upward pressure on global yields, while higher rates increase dispersion across risk assets, reinforcing the case for selectivity.
Market backdrop
The global bond sell-off that has defined the summer gathered fresh momentum last week, pushing yields to multi-year highs across the U.S., Europe and Japan. We see further upward pressure from higher oil prices and rate-hike expectations, alongside persistent inflation, heavy government borrowing and rising corporate financing needs. Higher yields need not diminish the appeal of bonds: they have transformed the opportunity set for income, provided investors stay selective about the risks they take to earn it.
U.S. inflation takes center stage after a blowout jobs report last week strengthened expectations for a Fed rate increase this month. We still don’t see a hike as a foregone conclusion. This week’s CPI report will provide another crucial piece of data, with a hot print likely to tip the balance toward a hike and push global yields higher.
Week ahead
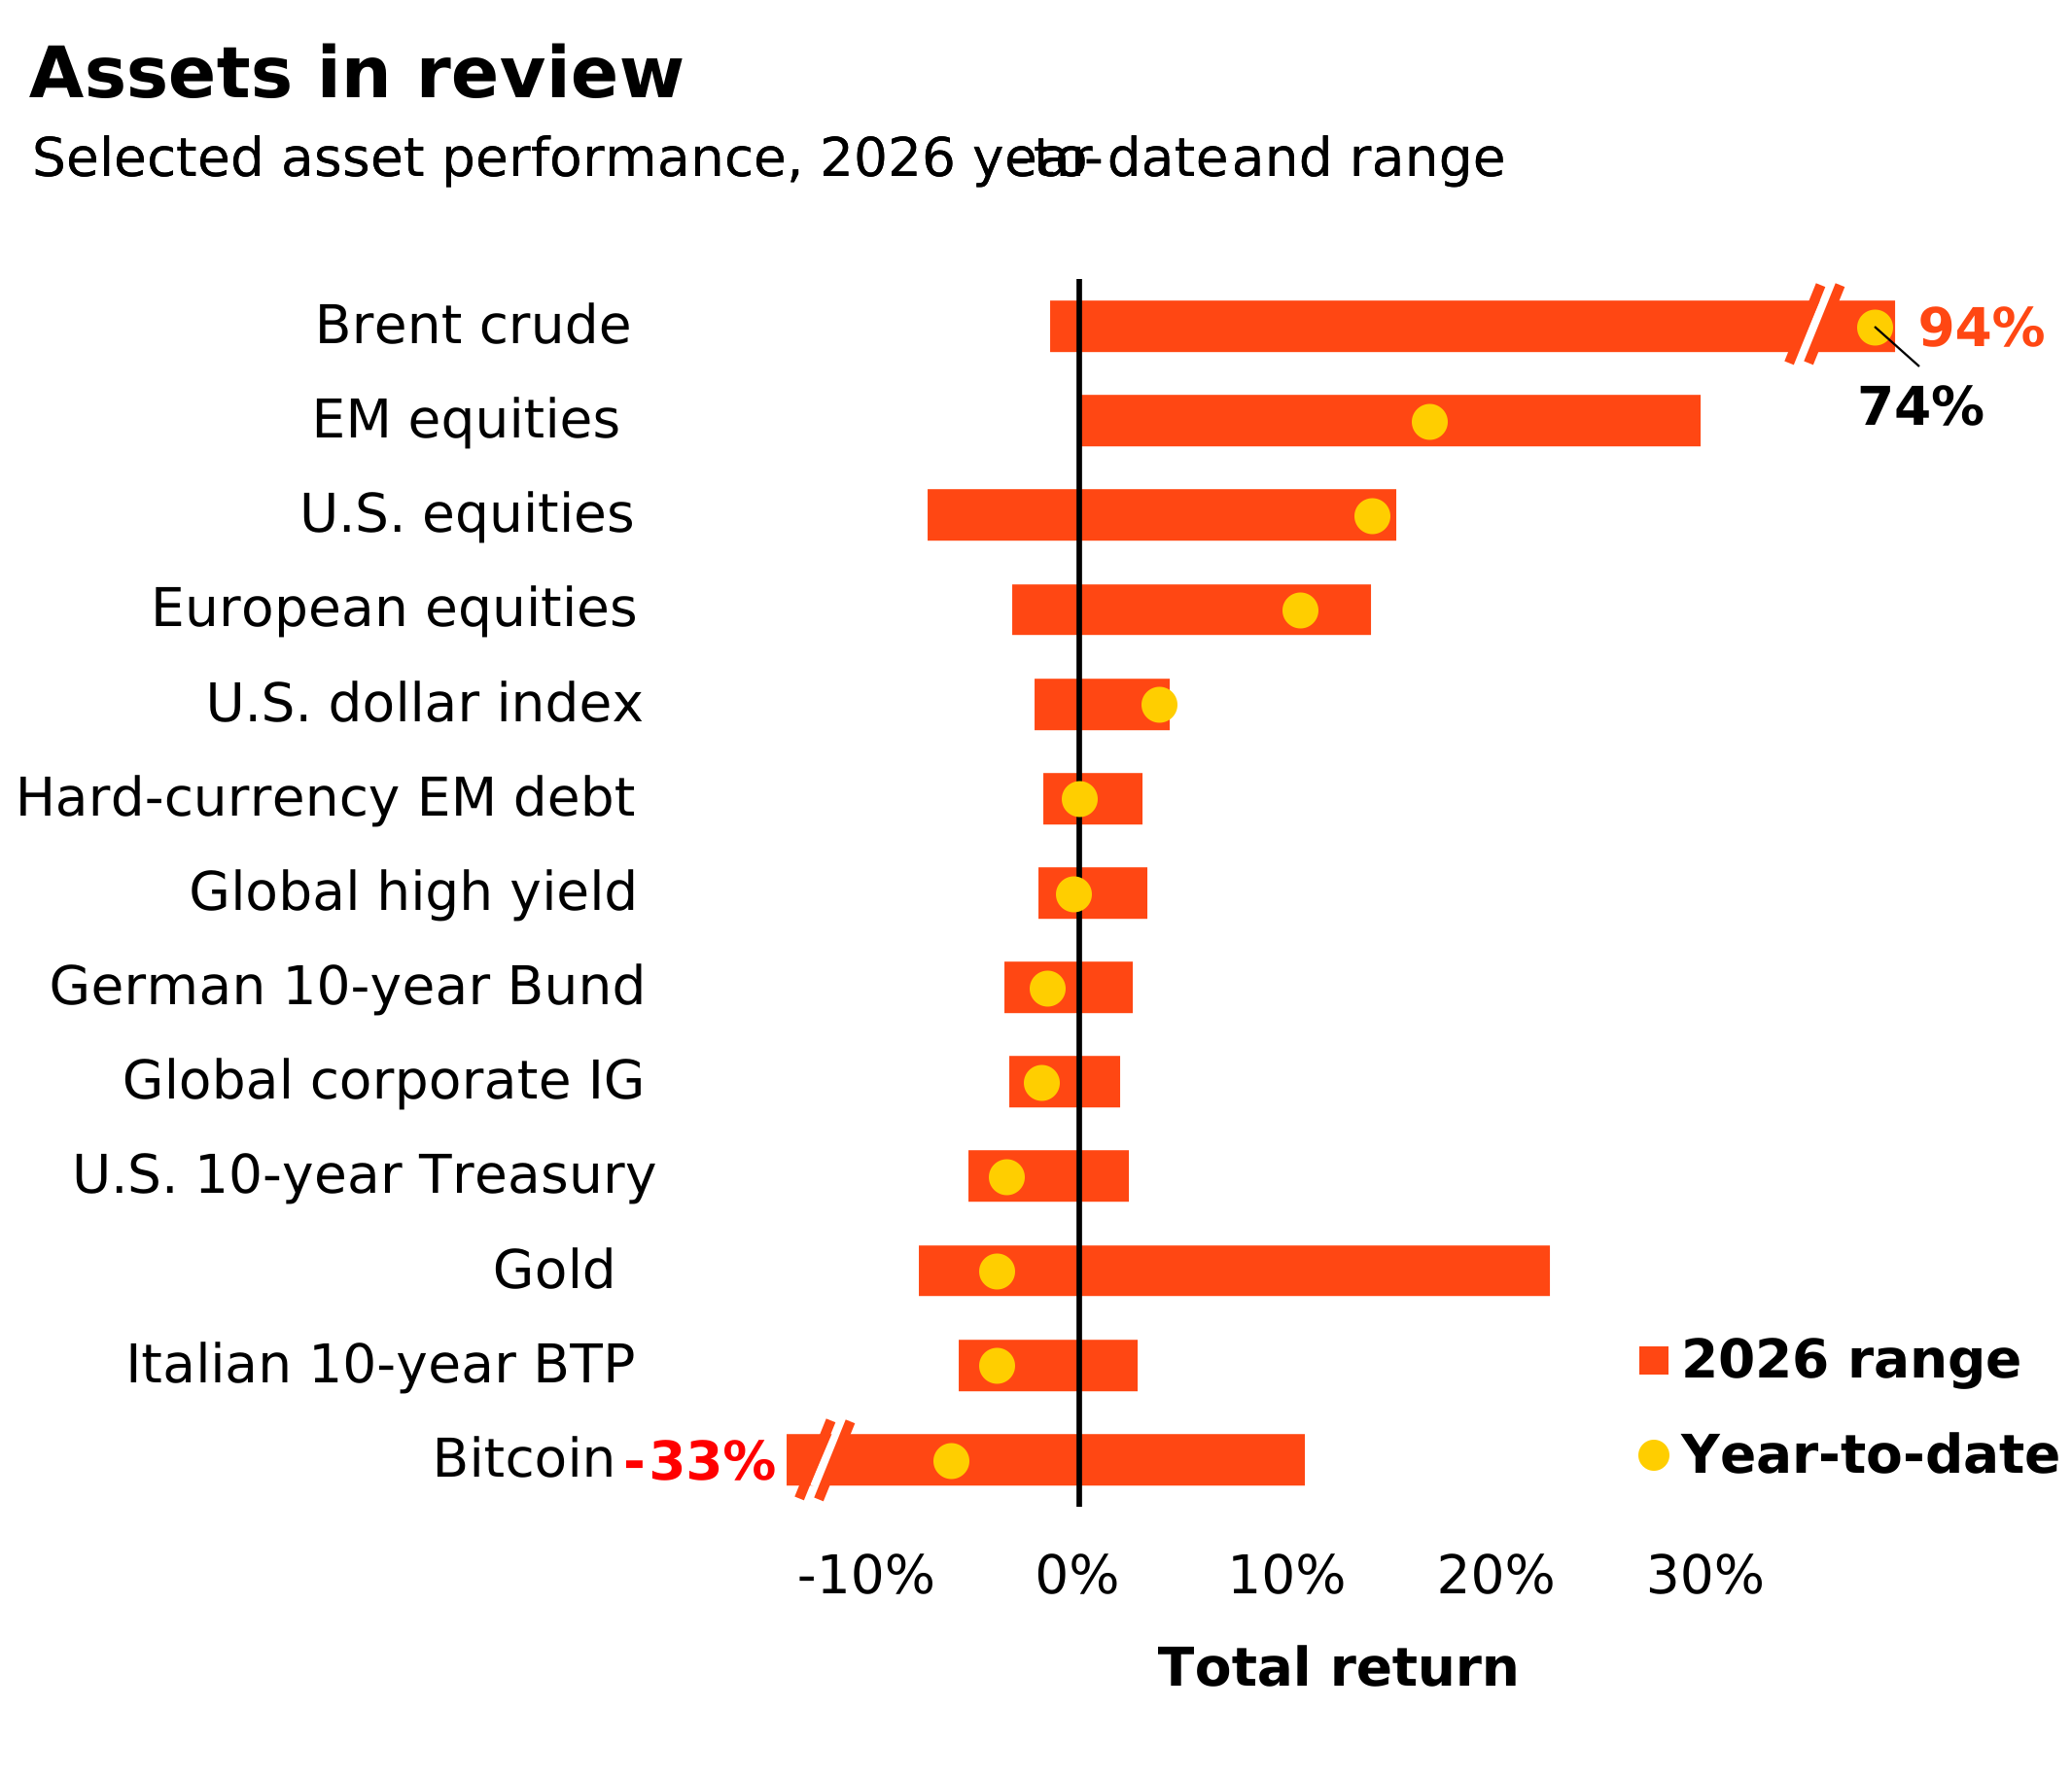
Past performance is not a reliable indicator of current or future results. Indexes are unmanaged and do not account for fees. It is not possible to invest directly in an index. Sources: BlackRock Investment Institute, with data from LSEG Datastream as of September 3, 2026. Notes: The two ends of the bars show the lowest and highest res at any point year to date, and the dots represent current year-to-date res. Emerging market (EM), high yield and global corporate investment grade (IG) res are denominated in U.S. dollars, and the rest in local currencies. Indexes or prices used are: spot Brent crude, ICE U.S. Dollar Index (DXY), spot gold, spot bitcoin, MSCI Emerging Markets Index, MSCI Europe Index, LSEG Datastream 10-year benchmark government bond index (U.S., Germany and Italy), Bloomberg Global High Yield Index, J.P. Morgan EMBI Index, Bloomberg Global Corporate Index and MSCI USA Index.
Japan revised GDP; China trade balance
China CPI and PPI
U.S. PPI; ECB rate
U.S CPI and UMich sentiment; UK GDP estimate
Read our past weekly market commentaries here.
Intersecting mega forces
Since we launched our mega forces framework it has become clearer how their intersection shapes almost all our investment views and opens up alpha opportunities. They cut across asset class labels, spurring a rethink of portfolio construction. Investors need to be deliberate about the economic or thematic exposures they own, the vehicles they use to implement them and their investment horizons.

From drivers to portfolio expressions
Our highest conviction views, September 2026
| Driver | What we think | Portfolio expression |
|---|---|---|
| Growth and AI scarcity | The AI buildout is speeding up, making bottlenecks binding. | Overweight U.S. equities; focus on AI bottleneck opportunities: power, chips and data centers. |
| Duration and diversification | Long bonds carry high rate sensitivity and are less reliable diversifiers. | Prefer short- and medium-term government bonds over long bonds for income. |
| Credit spreads and liquidity | Selectivity is crucial amid tight spreads and uneven fundamentals. | Credit with clear cash flows, lender protections and recovery value; higher-rated high yield. |
| Inflation and scarcity | Scarcity, secure supply and power demand carry inflation risks. | Infrastructure, energy bottlenecks, EM local debt and real-asset-linked exposures. |
| Alpha opportunity | Macro outcomes matter again in the new regime. | Macro hedge funds, venture capital, market-neutral strategies, and selected private credit and non-U.S. alpha. |
Note: Views are from a U.S. dollar perspective, September 2026. This material represents an assessment of the market environment at a specific time and is not intended to be a forecast of future events or a guarantee of future results. This information should not be relied upon by the reader as research or investment advice regarding any particular funds, strategy or security.
Asset class implications
Six- to 12-month tactical positioning, September 2026
This shows the implementation of our key investment views from the previous page through an asset class lens.

| Asset | Tactical view | Commentary | ||||
|---|---|---|---|---|---|---|
| Equities | ||||||
| United States | We are overweight. Strong corporate earnings, fueled by the AI buildout and a favorable macro backdrop, are outpacing higher interest rate expectations. | |||||
| Europe | We are neutral. We would need to see more business-friendly policy and deeper capital markets for Europe to outperform. We favor financials, infrastructure, and industrials. | |||||
| UK | We are neutral. Valuations remain attractive relative to the U.S., but we see few near-term catalysts to trigger a shift. | |||||
| Japan | We are neutral. Strong corporate balance sheets and governance reforms remain supportive. We prefer targeted exposures to physical AI and the buildout’s bottlenecks. | |||||
| Emerging markets (EM) | We are neutral. We see opportunities where the AI buildout drives demand for infrastructure, particularly in Latin America. | |||||
| China | We are neutral. We see opportunities in physical AI. Cheap, open-source AI could drive adoption, but that doesn’t necessarily translate into AI-provider profitability. | |||||
| Fixed income | ||||||
| Short U.S. Treasuries | We are neutral. We prefer short- and medium-term Treasuries, given the attractive risk-adjusted income on offer. | |||||
| Long U.S. Treasuries | We are underweight. We see investors wanting more compensation for holding long-term bonds amid persistent inflation and high debt loads. Long-duration bonds also are a less reliable portfolio diversifier in the new regime. | |||||
| Global inflation-linked bonds | We are neutral. We see inflation settling above pre-pandemic levels, but markets may not price this in the near term as economic growth could slow. | |||||
| Euro area government bonds | We are overweight short- and medium-term bonds. Markets are pricing restrictive policy rates of about 3% for several years. We think that’s overdone. | |||||
| UK gilts | We are neutral. We expect periods of elevated volatility given political uncertainty, longer-term bonds making up a larger market share, and buyers becoming more price-sensitive. | |||||
| Japanese government bonds | We are underweight. Rate hikes, higher global term premium and heavy bond issuance will likely drive yields up further. | |||||
| China government bonds | We are neutral. China bonds offer stability and diversification but developed market yields are higher. A shift in investor sentiment toward equities limits upside. | |||||
| U.S. agency MBS | We are overweight. Agency MBS offer higher income than Treasuries with similar risk and may offer more diversification amid fiscal and inflationary pressures. | |||||
| Short-term IG credit | We are neutral. Spreads are tight due to corporate strength; they could widen if issuance increases or risk appetite shifts. | |||||
| Long-term IG credit | We are underweight. We prefer short-term bonds less exposed to interest rate risk over long-term bonds. | |||||
| Global high yield | We are neutral. High yield offers attractive income. We prefer higher-rated U.S. and European high yield over investment grade and see dispersion of returns increasing. | |||||
| Asia credit | We are neutral. Overall yields are attractive and fundamentals are solid, but spreads are tight. | |||||
| Emerging hard currency | We are neutral. Fundamentals have improved, but we see a more attractive risk-reward profile in EM local debt. | |||||
| Emerging local currency | We are overweight. We like the yield relative to its volatility and improving fundamentals. | |||||
Past performance is not a reliable indicator of current or future results. It is not possible to invest directly in an index. Note: Views are from a U.S. dollar perspective. This material represents an assessment of the market environment at a specific time and is not intended to be a forecast or guarantee of future results. This information should not be relied upon as investment advice regarding any particular fund, strategy or security.
Euro-denominated tactical granular views
Six to 12-month tactical views on selected assets vs. broad global asset classes by level of conviction, September 2026

We have lengthened our tactical investment horizon back to six to 12 months. The table below reflects this and, importantly, leaves aside the opportunity for alpha, or the potential to generate above-benchmark returns – especially at a time of heightened volatility.
| Asset | Tactical view | Commentary | ||
|---|---|---|---|---|
| Equities | ||||
| Europe ex UK | We are neutral. We would need to see more business-friendly policy and deeper capital markets for Europe to outperform and to justify a broad overweight. We stay selective, favoring financials, infrastructure, industrials, materials and healthcare. | |||
| Germany | We are neutral. Higher spending on defense and infrastructure support the corporate sector. Valuations are not stretched but neither compelling and expected earnings growth lags other countries. Light positioning means potential easing in geopolitical tensions and AI lifting industrials-driven earnings could create opportunities. | |||
| France | We are neutral. Strong expected earnings growth and global revenue exposure support French corporates. Valuations are less compelling, albeit not stretched versus euro area peers. Persistent political uncertainty leaves the overall risk reward balanced. | |||
| Italy | We are neutral. Earnings growth and momentum are strong, boosted by the significant exposure to financials, utilities and energy. Valuations are still at discount vs. peers, but not as much as in previous years. Political risk is currently low but likely to pick up ahead of 2027 elections. | |||
| Spain | We are overweight. Valuations remain attractive vs. peers even if relative earnings momentum has slowed. Strong domestic demand growth and exposure to fast-growing areas like Latin America support Spanish stocks. Financials, utilities and infrastructure-linked stocks would benefit from Europe’s push towards autonomy. | |||
| Netherlands | We are neutral. Earnings revisions in the IT sector, a large sector in the Dutch stock market is offset by other sectors seeing less favorable valuations and a weaker earnings outlook than European peers. | |||
| Switzerland | We are neutral. Valuations have improved, from stretched levels, but the earnings outlook is weaker than other European markets. If global risk appetite stays strong, the index’s tilt to stable, less volatile sectors may weigh on performance . | |||
| UK | We are neutral. Valuations remain attractive relative to the U.S., but we see few near-term catalysts to trigger a shift. | |||
| Fixed income | ||||
| Euro area government bonds | We are overweight short- and medium-term bonds. Markets are pricing restrictive policy rates of about 3% for several years. We think that’s overdone. | |||
| German bunds | We are overweight shorter-term Bunds as the market-implied ECB policy path appears too hawkish. We stay neutral long-dated Bunds. Fiscal stimulus and increased bond issuance exert upward pressure on yields, alongside inflation risks amid lingering geopolitical tensions. | |||
| French OATs | We are neutral. Elevated political uncertainty, high budget deficits and slow structural reforms could stoke volatility, but these risks already seem priced into OATs and we don’t expect a material worsening from here. | |||
| Italian BTPs | We are neutral. The spread over German bunds looks tight given Italy’s large budget deficits and growing public debt. Domestic factors remain supportive, with growth holding up relative to the rest of the euro area and local demand for BTPs solid at current yield levels. Domestic disapproval would likely prevent defense spending from reaching fiscally unstable levels. Political uncertainty is likely to increase ahead of next year’s elections. | |||
| UK gilts | We are neutral. We expect periods of elevated volatility given political uncertainty, longer-term bonds making up a larger market share, and buyers becoming more price-sensitive. | |||
| Swiss government bonds | We are neutral. The SNB seems comfortable with its medium-term inflation outlook and its current policy stance. Market pricing is broadly in line with SNB messaging. | |||
| European inflation-protected securities | We are neutral. We see higher medium-term inflation, but inflation expectations are firmly anchored. Cooling inflation and uncertain growth may matter more near term. | |||
| European investment grade | European investment grade is supported by healthy corporate sector balance sheets, contained default rates and the persistently strong demand for durable income from European households. We prefer European investment grade over the U.S. | |||
| European high yield | We are overweight. While spreads are low, the income potential remains attractive. Defaults are contained and high yield is of higher quality and less sensitive to interest rate swings compared with the U.S. | |||
Past performance is not a reliable indicator of current or future results. It is not possible to invest directly in an index. Note: Views are from a euro perspective, September 2026. This material represents an assessment of the market environment at a specific time and is not intended to be a forecast or guarantee of future results. This information should not be relied upon as investment advice regarding any particular fund, strategy or security.
On the go?