Upgrading U.S. Treasuries to lock in income

Market take
Weekly video_20261012
Wei Li
Global Chief Investment Strategist
BlackRock
SCRIPT
Camera frame
Title slide: Upgrading U.S. Treasuries to lock in income
This week we are making some tactical view changes, in particular changing our views on U.S. Treasuries and U.S. equities.
1: Locking in U.S. Treasury income
Starting with U.S. Treasuries, we first went underweight U.S. long-duration Treasuries back in October 2020, when the U.S. 10-year [yield] was still below 0.9%.
Since then, we have had brief periods of neutral but stayed mostly underweight.
The U.S. 10-year [yield] is now at five and a quarter [5.25%], and we are upgrading to neutral to lock in income.
We’re refraining from making a bigger bullish call on the long end of the U.S. Treasuries market and instead are upgrading front-end Treasuries into overweight, given the greater income buffer for further yield increases.
2: Downgrading U.S. equities
On U.S. equities, we are bringing overweight to neutral, partly funding the Treasuries upgrade.
We still prefer AI and tech within the neutral stance.
This is a short-term risk management move, really reflecting the fact that we believe investors need to be more dynamic in this new market and macro regime.
3: A more dynamic approach
Our conviction in the fundamentals remains intact, and we stand ready to add risk on potentially more attractive venture points.
Other adjustments include trimming our Japanese government bond underweight, after Japanese 10-year [yields] rose from [around] 0.4% when we first initiated the position in mid-2023 to now around 3%.
Outro: Here’s our Market take
The big picture is that the new investment regime requires a very dynamic approach.
We are managing risk, not changing our core convictions.
And we’re also monitoring growing population focus on AI policy and AI buildout.
Closing frame: Read details: blackrock.com/weekly-commentary
Income in focus
We upgrade U.S. Treasuries, preferring short-term bonds, as higher yields improve potential returns, partly funded by downgrading U.S. equities to neutral.
Market backdrop
Global bonds swung sharply last week, with 10- and 30-year U.S. Treasury yields hitting 24-year highs before retreating after strong bond auctions.
Week ahead
U.S. CPI and PPI offer the first look at September inflation this week. We watch for signs that could shift Fed expectations and Treasury yields.
Higher yields and potentially excessive Fed tightening expectations create room to unwind our U.S. Treasury underweight – a mainstay for most of the last six years. We upgrade Treasuries, favoring short-term bonds. In turn, we take profits: downgrading U.S. equities to neutral to manage potential volatility around the AI buildout and trimming our Japanese government bond (JGB) underweight. We retain our conviction in AI fundamentals and preference for AI within U.S. equities.
Paragraph-2,Image-1
Paragraph-3,Advance Static Table-1,Paragraph-4,Advance Static Table-2
Anatomy of a 5% yield
10-year U.S. Treasury yield decomposition, 2005–26
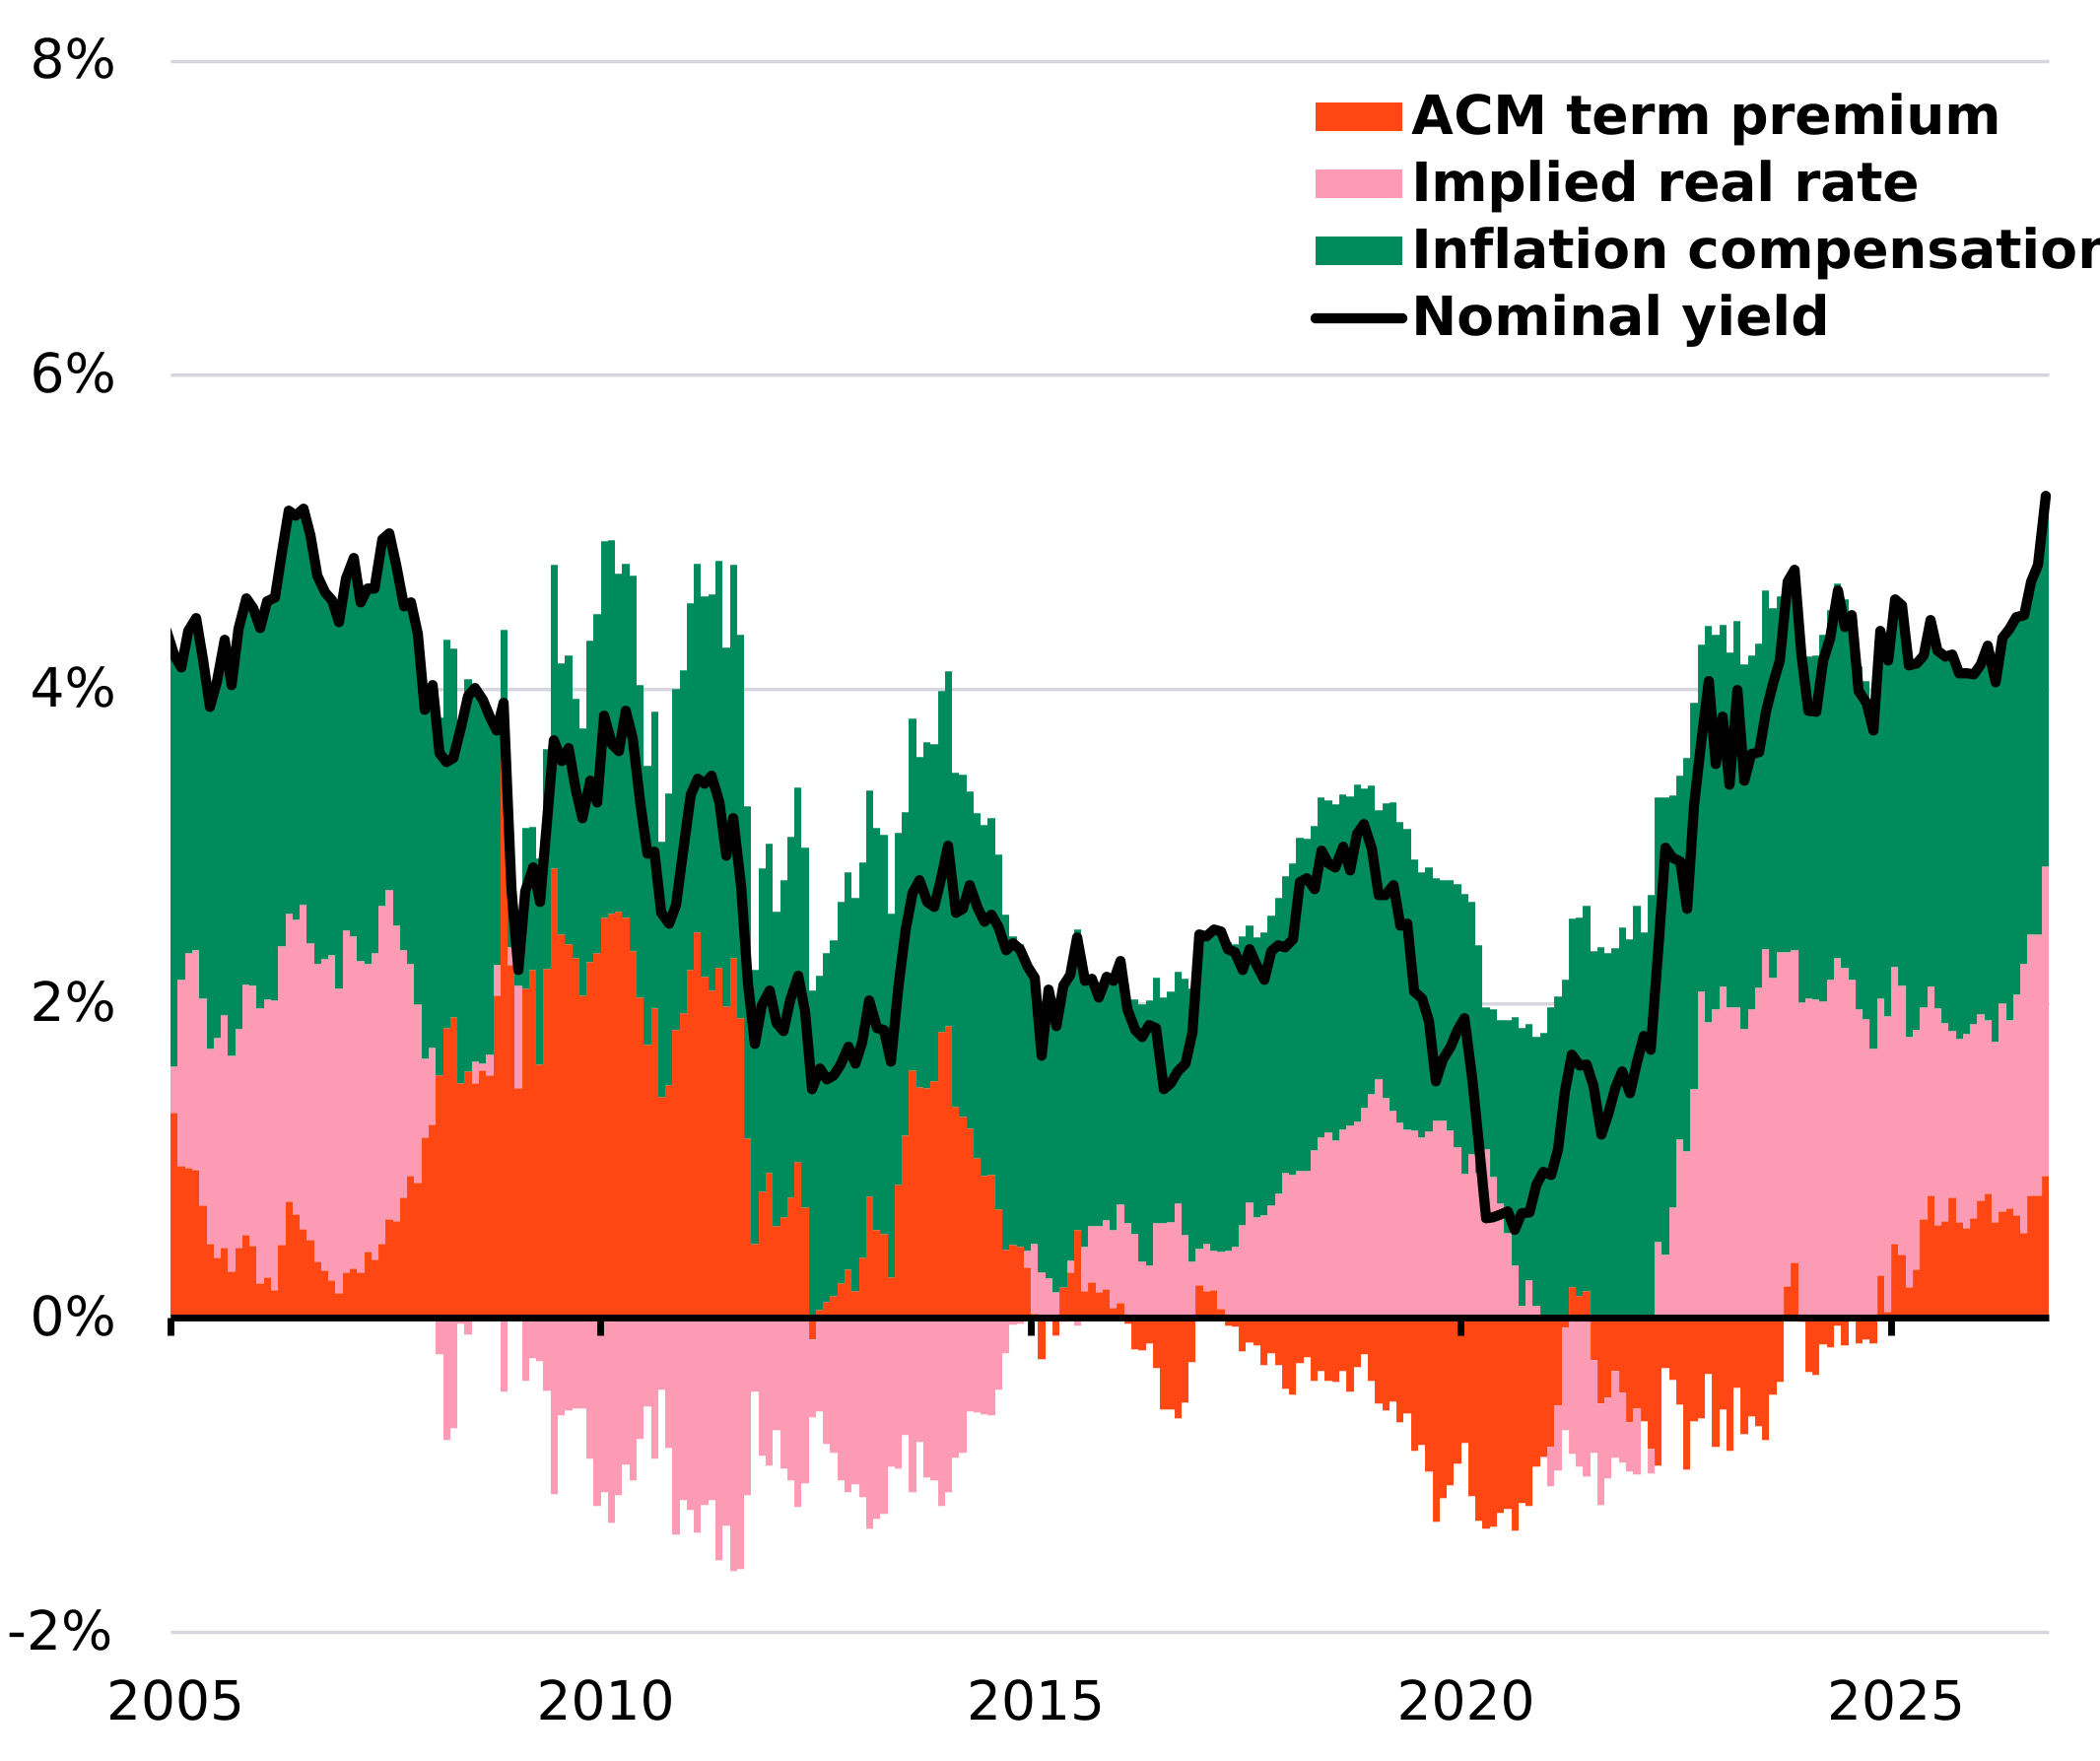
The figure shown relates to past performance. Past performance is not a reliable indicator of current or future results. The ACM term premium is a model-based estimate subject to uncertainty. Source: BlackRock Investment Institute, with data from LSEG Datastream and the Federal Reserve Bank of New York, October 2026. Notes: Inflation compensation is based on 10-year breakeven inflation. The implied real rate is calculated as the nominal yield less inflation compensation and the ACM term premium. The decomposition is illustrative, not a model-based estimate.
The 10-year Treasury yield has risen 110 basis points this year to around 5.25%, driven mainly by higher real interest rates rather than inflation expectations or term premium. Two forces are behind the rise in real rates: intensifying competition for capital is pushing up the neutral rate while Middle East tensions and higher oil prices have driven a sharp reversal in Fed rate expectations. Since January, markets have priced in 160 additional basis points of Fed tightening over the next 12 months. We think that is overdone. With term premium averaging around 75 basis points since September, higher yields offer a more attractive entry point. At current yields, our analysis suggests a 75-basis-point cushion against further yield increases over 12 months before total returns turn negative. That supports adding U.S. Treasuries, especially at the short end, where we see the greatest scope for Fed tightening expectations to unwind.
We are adding Treasuries from across the curve. For most of the last six years, we’ve been underweight Treasuries, turning neutral in spots. Now, yields have reset toward our long-held higher-rates view, and we want to lock in some attractive income. Ten-year Treasury yields sat near 0.9% back in October 2020 when we first went underweight and have since surged to 24-year highs above 5.3%. We are upgrading shorter-term Treasuries to overweight, where we see scope for excessive Fed tightening expectations to unwind, and long-term Treasuries to neutral as higher yields now provide better compensation for interest-rate risk. We also trim our underweight in JGBs, held since July 2023 when 10-year yields were at 0.4%-0.5%, compared with above 3% now. We fund the Treasury upgrades partly from U.S. agency mortgage-backed securities that have been a stable source of income in portfolios and we are now neutral.
Downgrading U.S. equities
We also fund the Treasury upgrades by closing our long-held U.S. equity overweight to neutral. This is a short-term risk-management move, reflecting our belief that investors must be more dynamic in today’s volatile macro and market regime. We are also monitoring growing population focus on AI policy and the AI buildout in jurisdictions across the country.
Our fundamental convictions on AI transformation remain intact. Higher rates are increasingly differentiating companies by their ability to generate earnings and returns above the cost of capital. We still favor AI-related companies and listed infrastructure, where growing demand and scarcity in critical infrastructure support attractive returns. Existing infrastructure could grow even more valuable amid this scarcity. Despite narrative swings, we believe fundamentals will ultimately prevail. We also maintain our emerging market equity overweight. FactSet data shows third-quarter earnings for S&P 500 companies are expected to grow nearly 30% year-on-year.
Our bottom line
We are managing near-term risk, not changing our core convictions. Higher yields offer an opportunity to add Treasuries, funded partly by taking profits on U.S. equities. We remain constructive on AI and stand ready to add risk again as visibility improves and attractive entry points emerge.
Market backdrop
Global government bonds saw another volatile week, with 10- and 30-year U.S. Treasury yields hitting their highest levels since 2002 before retreating after strong bond auctions. European bonds also sold off, led by France amid fiscal concerns. Oil prices rose as Middle East tensions persisted, adding to inflation worries. We see the bond selloff as reinforcing our competition-for-capital thesis, while higher yields improve the case for owning Treasuries.
U.S. CPI and PPI data take center stage this week, offering the first snapshots of September inflation. Fed minutes last week underscored caution about the policy path and the importance of incoming data. We are watching for persistent price pressures amid higher energy costs and recent PCE methodology changes, with the readings likely to shape Fed rate expectations and Treasury yields.
Week ahead
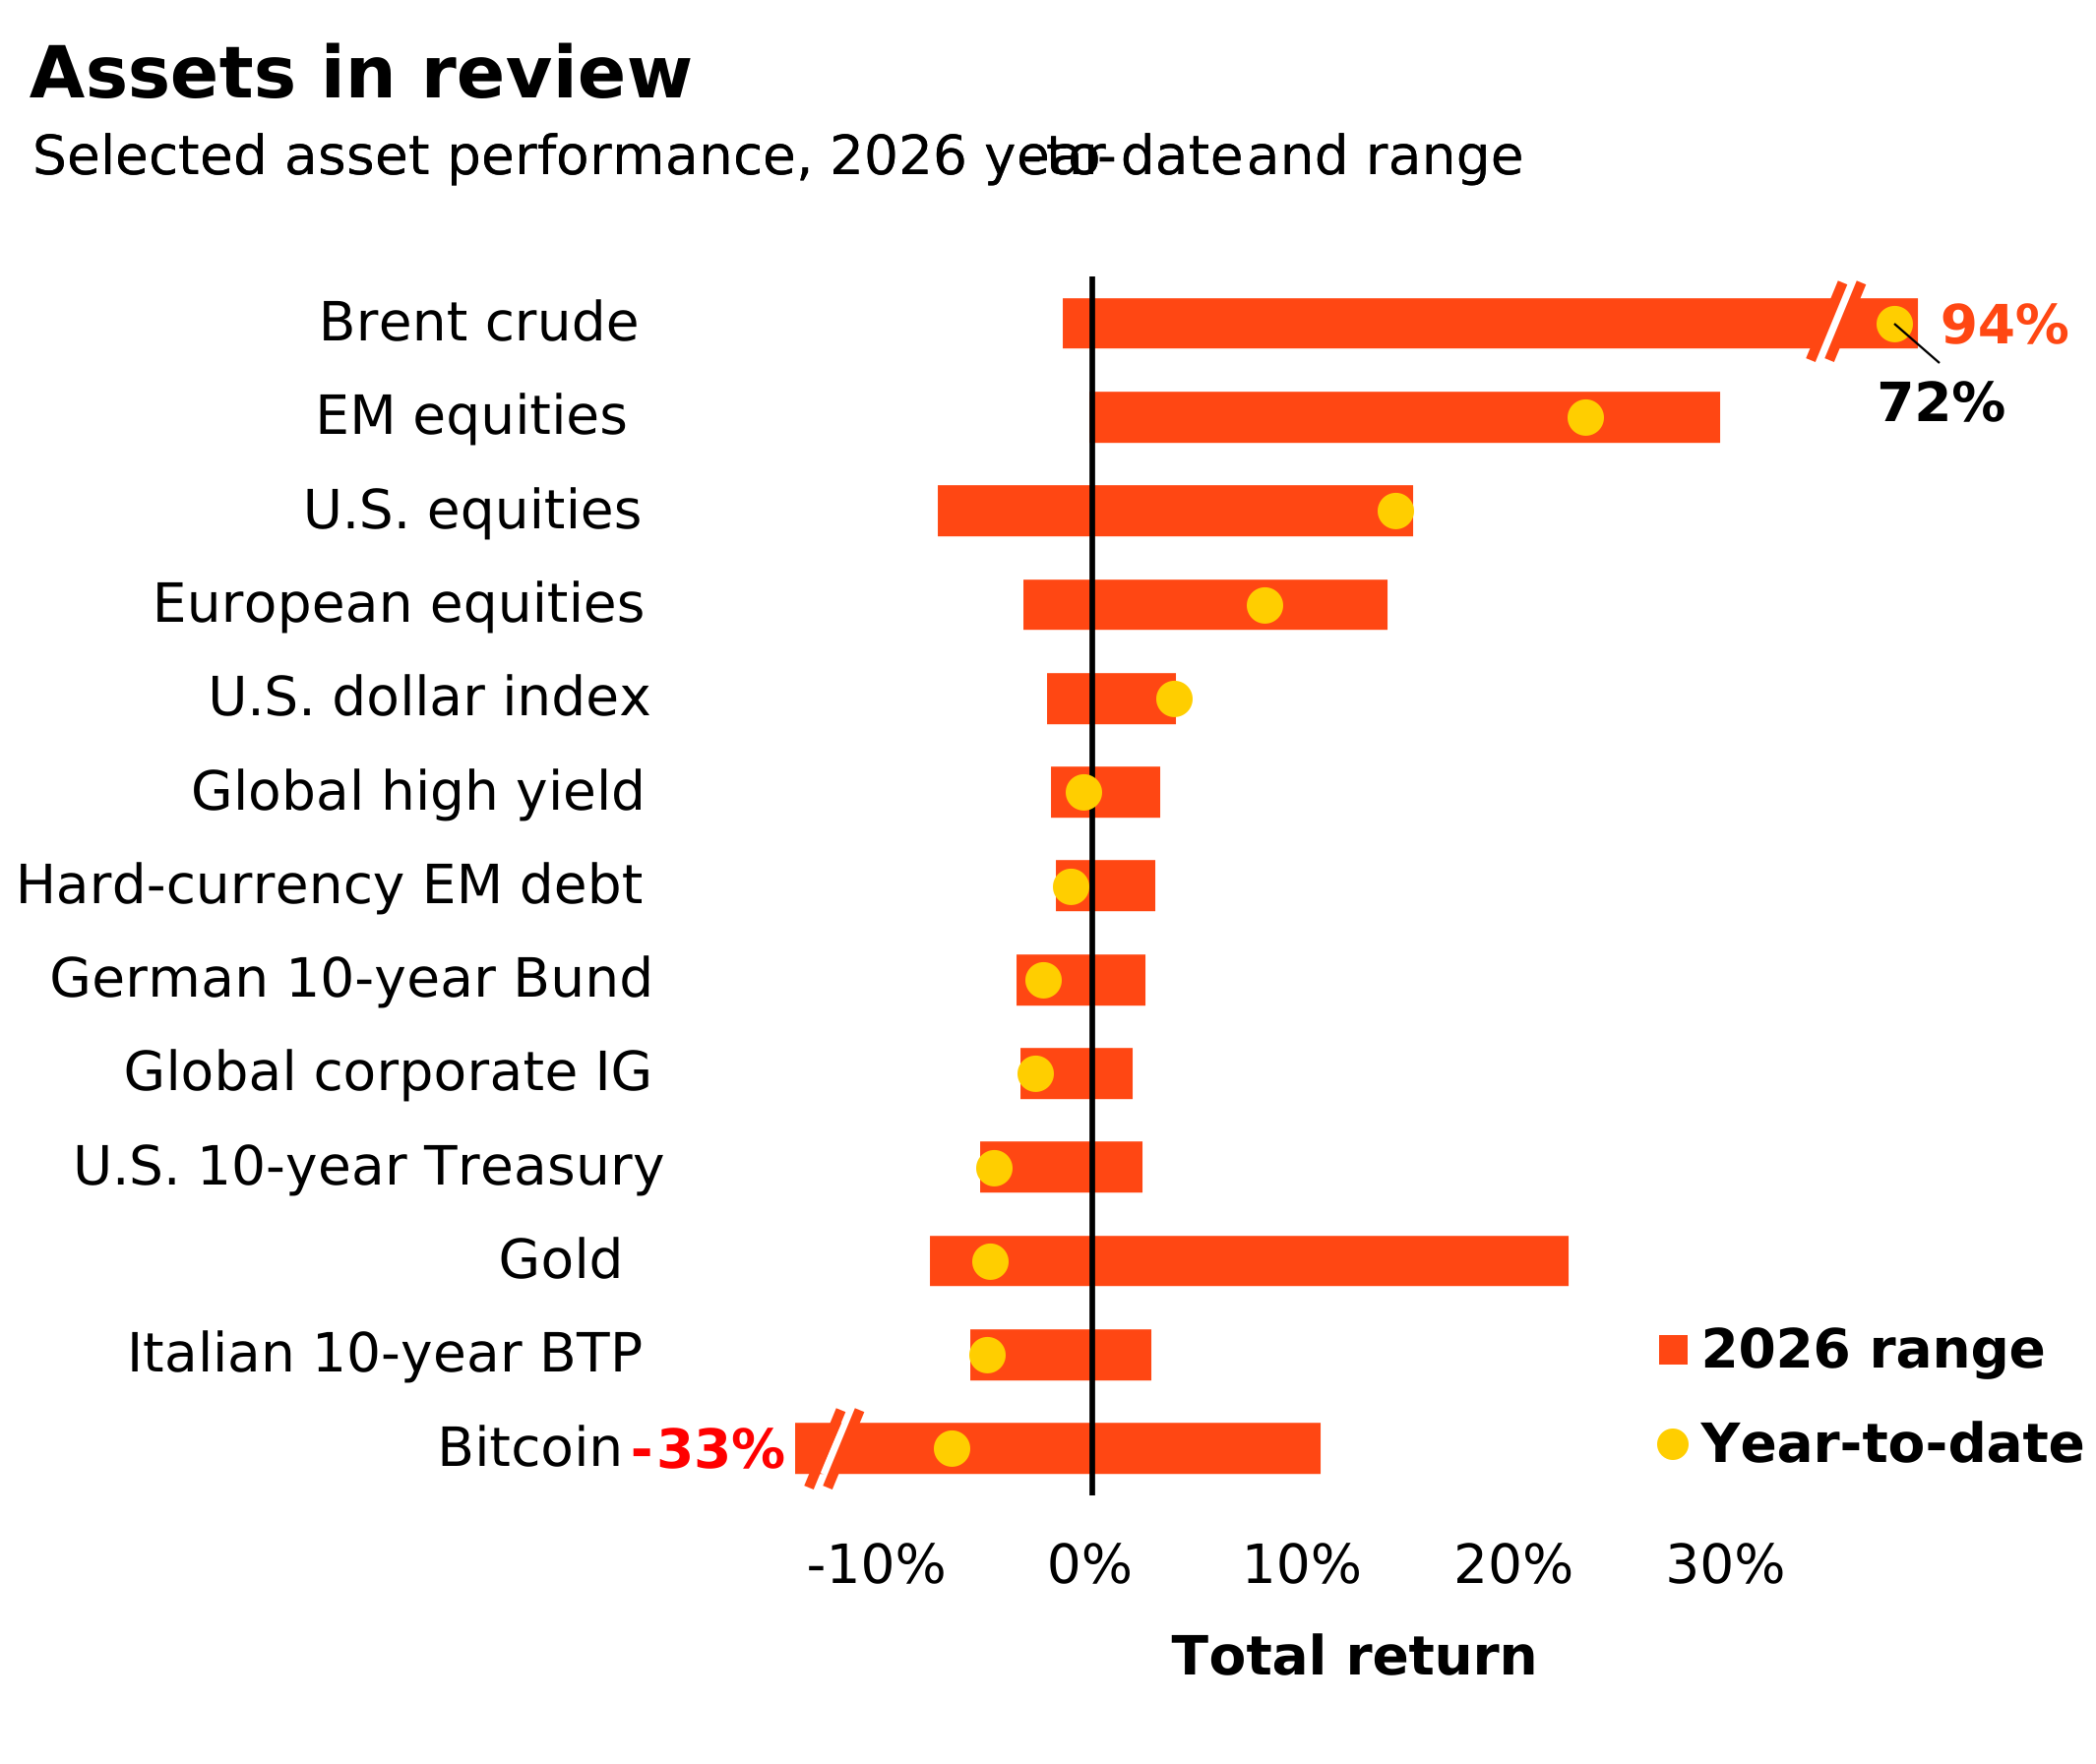
Past performance is not a reliable indicator of current or future results. Indexes are unmanaged and do not account for fees. It is not possible to invest directly in an index. Sources: BlackRock Investment Institute, with data from LSEG Datastream as of October 8, 2026. Notes: The two ends of the bars show the lowest and highest returns at any point year to date, and the dots represent current year-to-date returns. Emerging market (EM), high yield and global corporate investment grade (IG) returns are denominated in U.S. dollars, and the rest in local currencies. Indexes or prices used are: spot Brent crude, ICE U.S. Dollar Index (DXY), spot gold, spot bitcoin, MSCI Emerging Markets Index, MSCI Europe Index, LSEG Datastream 10-year benchmark government bond index (U.S., Germany and Italy), Bloomberg Global High Yield Index, J.P. Morgan EMBI Index, Bloomberg Global Corporate Index and MSCI USA Index.
Oct. 12
Japan PPI
Oct. 14
U.S. CPI
Oct. 15
U.S. PPI and retail sales, UK GDP estimate
Oct. 16
EU trade balance, U.S. industrial production
Intersecting mega forces
Since we launched our mega forces framework, it has become clearer how their intersection shapes almost all our investment views and opens up alpha opportunities. They cut across asset class labels, spurring a rethink of portfolio construction. Investors need to be deliberate about the economic or thematic exposures they own, the vehicles they use to implement them and their investment horizons.

From drivers to portfolio expressions
Our highest conviction views, October 2026
| Driver | What we think | Portfolio expression |
|---|---|---|
| Growth and AI scarcity | AI fundamentals are strong, but we eye near-term volatility. | Neutral U.S. equities and overweight EM equities; favor AI- and tech-related opportunities. |
| Duration and diversification | Higher starting yields improve prospective returns and income. | Overweight short-term U.S. Treasuries for solid income and a cushion against higher rates; neutral long-term Treasuries. |
| Credit spreads and liquidity | Selectivity is crucial amid tight spreads and uneven fundamentals. | Credit with clear cash flows, lender protections and recovery value; higher-rated high yield. |
| Inflation and scarcity | Scarcity, secure supply and power demand carry inflation risks. | Infrastructure, energy bottlenecks, EM local debt and real-asset-linked exposures. |
| Alpha opportunity | Macro outcomes matter again in the new regime. | Macro hedge funds, venture capital, market-neutral strategies, and selected private credit and non-U.S. alpha. |
Note: Views are from a U.S. dollar perspective, October 2026. This material represents an assessment of the market environment at a specific time and is not intended to be a forecast of future events or a guarantee of future results. This information should not be relied upon by the reader as research or investment advice regarding any particular funds, strategy or security.
Asset class implications
Six- to 12-month tactical positioning, October 2026
This shows the implementation of our key investment views from the previous page through an asset class lens.

Past performance is not a reliable indicator of current or future results. It is not possible to invest directly in an index. Note: Views are from a U.S. dollar perspective. This material represents an assessment of the market environment at a specific time and is not intended to be a forecast or guarantee of future results. This information should not be relied upon as investment advice regarding any particular fund, strategy or security.
Meet the Authors

Jean Boivin
Head – BlackRock Investment Institute

Rick Rieder
Chief Investment Officer of Global Fixed Income – BlackRock

Wei Li
Global Chief Investment Strategist – BlackRock

We are neutral. We would need to see more business-friendly policy and deeper capital markets for Europe to outperform. We favor financials, infrastructure and industrials.
We are neutral on short- and medium-term bonds. Current ECB rate pricing looks fairly valued given the balance of risks. Higher energy prices could push rates higher. We prefer to deploy risk elsewhere.
We are neutral. Spreads are tight due to corporate strength, but attractive overall yields help offset the risk of increased issuance.