
In this quarterly report the Australian Fixed Income team provide a concise domestic economic, credit and currency outlook for Q3 2026.
Paragraph-1
Paragraph-2
Paragraph-3,Accordion-1
Monetary and Fiscal Policy – a focus on inflation
In Australia, the RBA maintained a restrictive policy stance throughout the quarter, with the May Statement on Monetary Policy reinforcing its expectation that inflation will return to target only gradually. While headline inflation has started to ease, underlying inflation remains elevated and domestic services inflation has proven more persistent than expected.
The RBA’s updated forecasts highlighted a slowdown in economic activity alongside a somewhat tighter labour market, supporting the Board’s view that restrictive financial conditions may need to remain in place for some time. Policymakers continue to balance evidence of softer household demand and consumer and business confidence against the risk that inflation remains above target for longer than anticipated.
This quarter also saw the release of the Federal Budget and associated public debate regarding broader tax, housing and structural reform measures. While there have been considerable commentary around potential changes to areas such as housing taxation and investment incentives, fixed income markets have so far focused more on inflation implications than unlegislated reform debate. The measures contained within the Budget generally provided targeted cost-of-living relief alongside continued investment in housing, infrastructure, healthcare and energy transition.
Growth and Market Conditions – Moderation
The combination of higher official cash rates, elevated living costs and softer household spending continues to weigh on private sector demand. While headline activity has remained positive, the latest national accounts point to a more uneven growth mix: household consumption remains subdued, GDP per capita contracted slightly, and public demand provided limited offset.
Australian 10-year bond yields drifting lower over the quarter, ending June at around 4.73%. This reflects both lower oil prices and a partial unwinding of the inflation and policy premium embedded earlier in the year. While Australian yields are little changed since the start of year, US and UK 10-year bonds rose around 30 basis points, and Japan 10 years by around 60 basis points on stronger economic data.
Credit Markets – Stable Spreads, Strong Issuance, and Technical Tailwinds
Credit markets have remained resilient at the headline level, supported by strong demand for income and broadly healthy fundamentals. However, we are seeing increasing dispersion as higher rates and slower growth begin to impact sectors unevenly. We see a growing divide between sectors with stable, policy aligned cash flows and those more exposed to rates and consumption pressure. Preferred exposures include utilities and infrastructure, alongside defensive areas like telecommunications. In contrast, we remain more cautious on rate-sensitive sectors, including REITs, and consumer-exposed industries where earnings pressure is building. Primary issuance remains well supported, with investor demand focused on high quality yield and structural growth themes.
Notable issuance trends include:
- Data centres and digital infrastructure
- Infrastructure sectors
- Financials and securitization
Looking ahead to Q3 2026, the macro and market environment is expected to be characterised by moderation rather than deterioration, with policy, growth and inflation dynamics all moving into a more balanced phase.
Monetary policy: Policy decisions will be seeking evidence that inflation is moving sustainably toward target. While economic growth has moderated, the May Statement on Monetary Policy reinforced the Board's view that inflation risks remain skewed to the upside. As a result, policy is expected to remain restrictive, with markets continuing to reassess the timing and extent of future policy adjustments as new inflation and labour market data emerge.
The RBA is expected to remain on hold in the very near term, with a tightening bias if inflation proves more persistent than expected. We anticipate another rate hike by end of year.
Growth: Economic activity is likely to slow further but remain positive, with household consumption under pressure from higher financing costs and still-elevated living expenses.
Inflation: Inflation is expected to gradually ease, although it is likely to remain above target in the near term, reinforcing the need for restrictive settings.
Credit: Credit conditions should remain supported by technical demand and strong starting yields, but we expect increasing dispersion and favour high-quality exposures and sectors with pricing power.
Rates & FX: Bond yields are likely to continue to trade in a range at elevated levels, while the AUD should remain range-bound, reflecting the balance between carry support and global risk dynamics.
Recent Market Data
-
▲ QoQ GDP grew 0.3%, with the annual rate lifting to 2.5% YoY
The annual pace was above consensus due to upward revisions to previous quarters. Household consumption rose (0.5% QOQ) largely driven by surge in energy costs alongside subdued discretionary spending. Private business investment (+6.0% QoQ) rose for the 6th quarter in a row led by machinery & equipment data centre expansion. The public sector saw consumption falling by -0.2% QoQ due to slowed down defence and local spending but investment rising by 0.9% QoQ. Detracting from GDP were net exports (-0.8ppt) as import growth (+2.1%) outstripped exports (-1.1%).
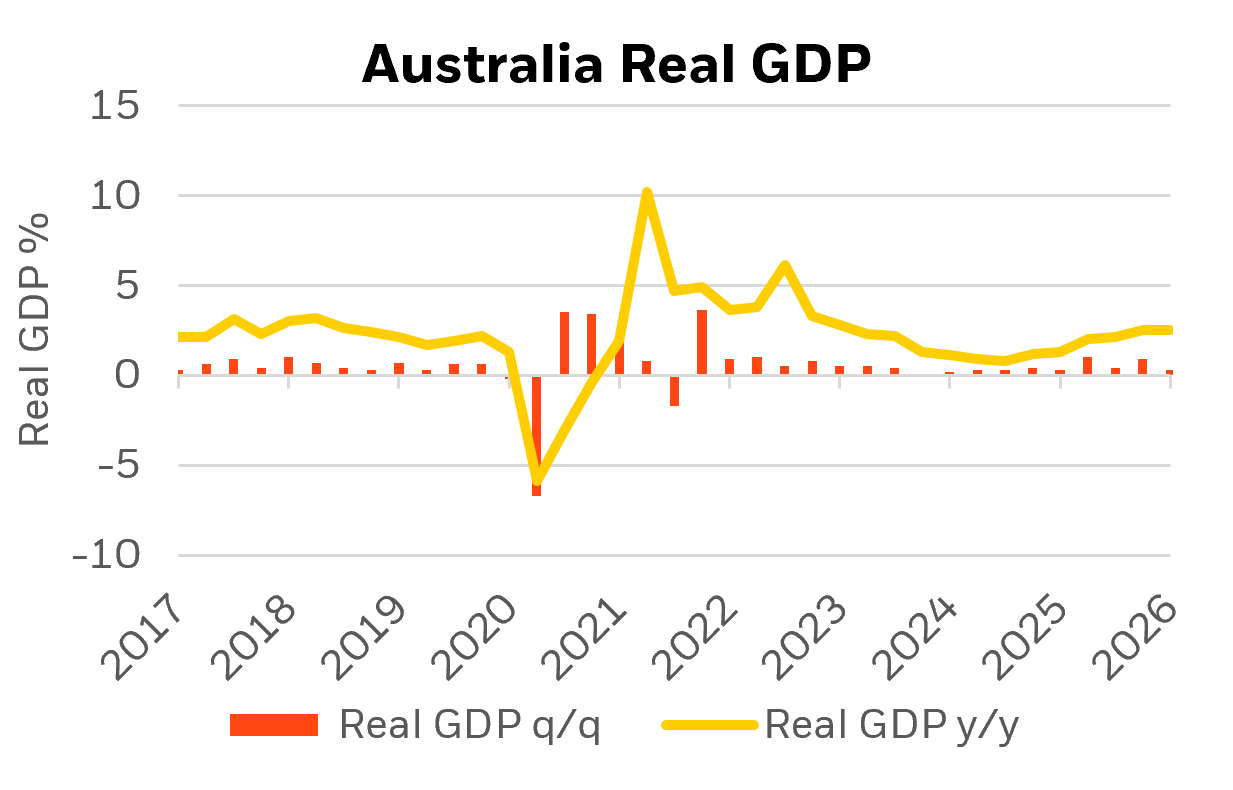
Source: ABS, Bloomberg, BlackRock as of 30/06/2026
-
▶ Conditions were unchanged MoM to +3pts
▲ Confidence rose +10pts MoM from -23 pts to -14ptsBusiness conditions in May were unchanged and remain below average levels at 3 index points. Conditions in sub-indicators were little changed, profitability (0→-1) remaining very weak whilst trading (7→8) and employment (1→2) improving marginally. Business confidence after crashing to -29 in March continued to improve rising from -23 to-14 in May. Capacity utilisation (82.4→81.9) fell below 82% for the first time since early 2025 and is now 1.4ppts below its recent high in late 2025. Forward orders recovered rising from -5 to 0. Both indicators suggest a shift lower in growth from 2025 levels. Purchase cost growth fell to 2.6% in quarterly equivalent terms, but remains elevated, and labour cost growth fell marginally to 1.5%.
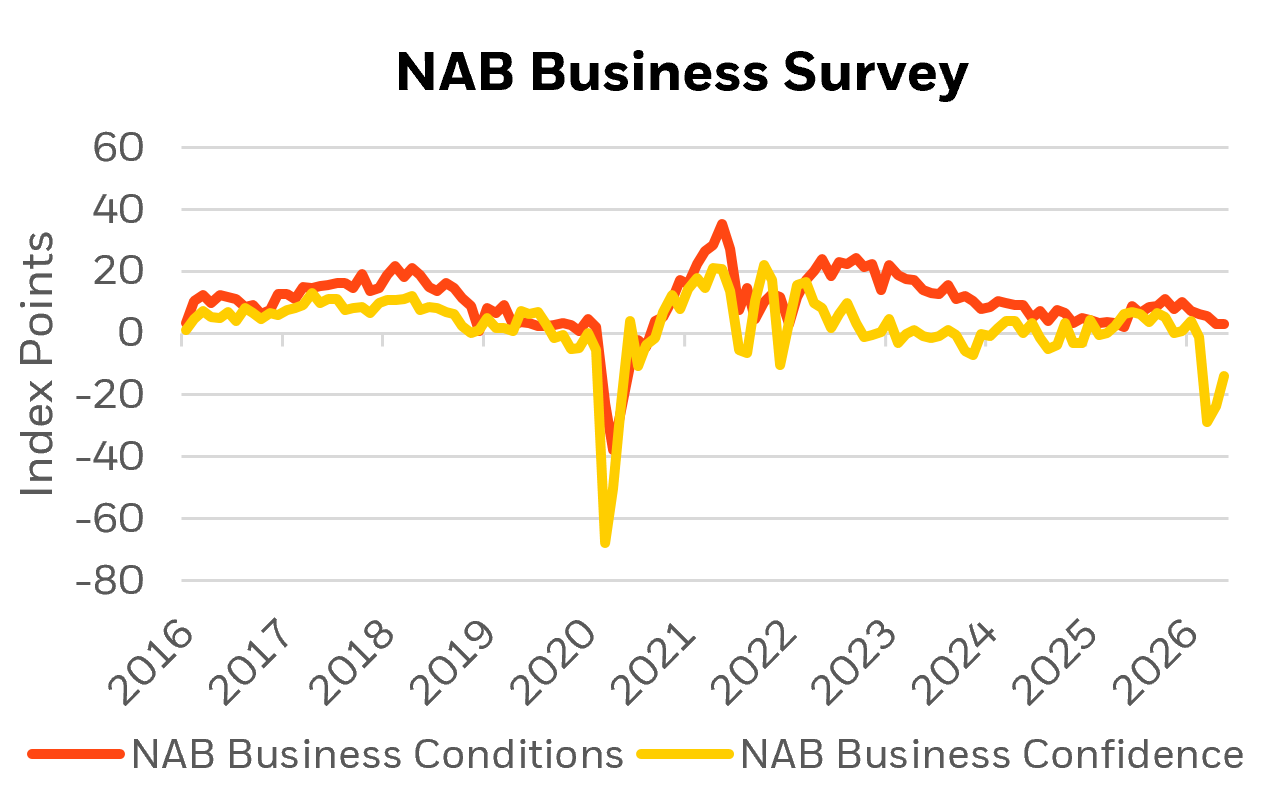
Source: NAB, Bloomberg, BlackRock as of 30/06/2026
-
▲ The Westpac-M.I. Index of Consumer Sentiment fell by 2.9% MoM to 80.6 in June.
Consumer sentiment remains deeply pessimistic. The sentiment shock that hit back in April eased off a touch in May but has intensified again in June. The ‘time to buy a major item’ sub‑index rose 0.9% to 86.4, though still at weak levels, while the ‘family finances vs a year ago’ sub‑index dropped by 7.5% to 67.3. The forward view speaks to particularly acute fears. As confidence in the economy over the next five years deteriorated further, with the sub‑index fell 3.2% to 86.5 and household financial expectations over the next 12 months fell by 8.5% to 85.1. The near‑term economic confidence weakened further, with the ‘economy, next 12 months’ sub‑index lifted 4.9% to 77.8, it still remains at a very weak level.
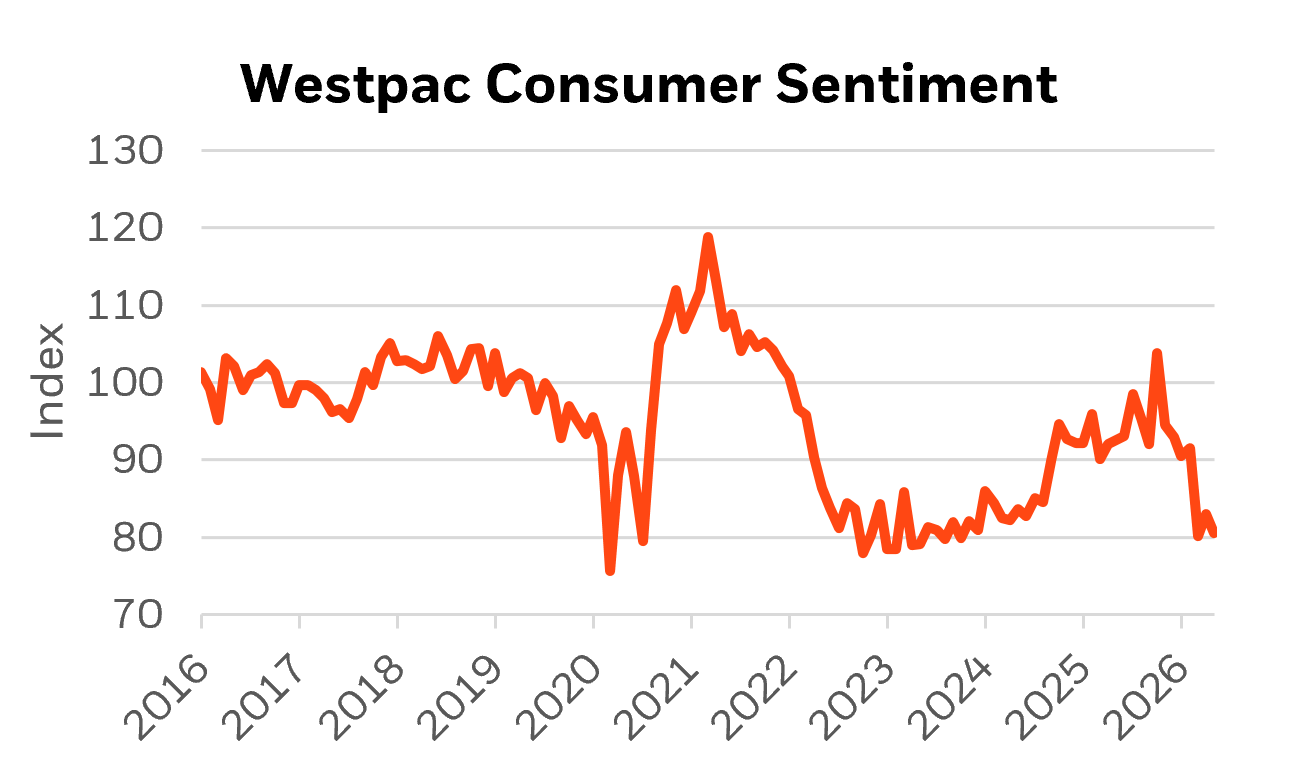
Source: Westpac, Bloomberg, BlackRock as of 30/06/2026
-
▲ Headline CPI fell by 0.7% MoM
▼ Annual inflation fell from 4.2% to 4.0%A closely watched measure of core inflation, the trimmed mean, also rose by 0.4% MoM with the annual rate lifting from 3.4% to 3.6%. Australian monthly CPI for May fell by -0.69%mom with the annual rate falling from 4.2% to 4.0%. Automotive fuel prices fell by -11.9% following a -7% fall in April as oil prices moderated. The decline subtracting -0.44bp from headline. The most significant contributors to the April annual rise were Food and non-alcoholic beverages (+3.3%), Housing (+6.5%), and Transport (+3.3%). Focus for the RBA will remain on the trimmed mean of the quarterly inflation series and the potential pass through of higher transport costs to other categories such as food and construction.
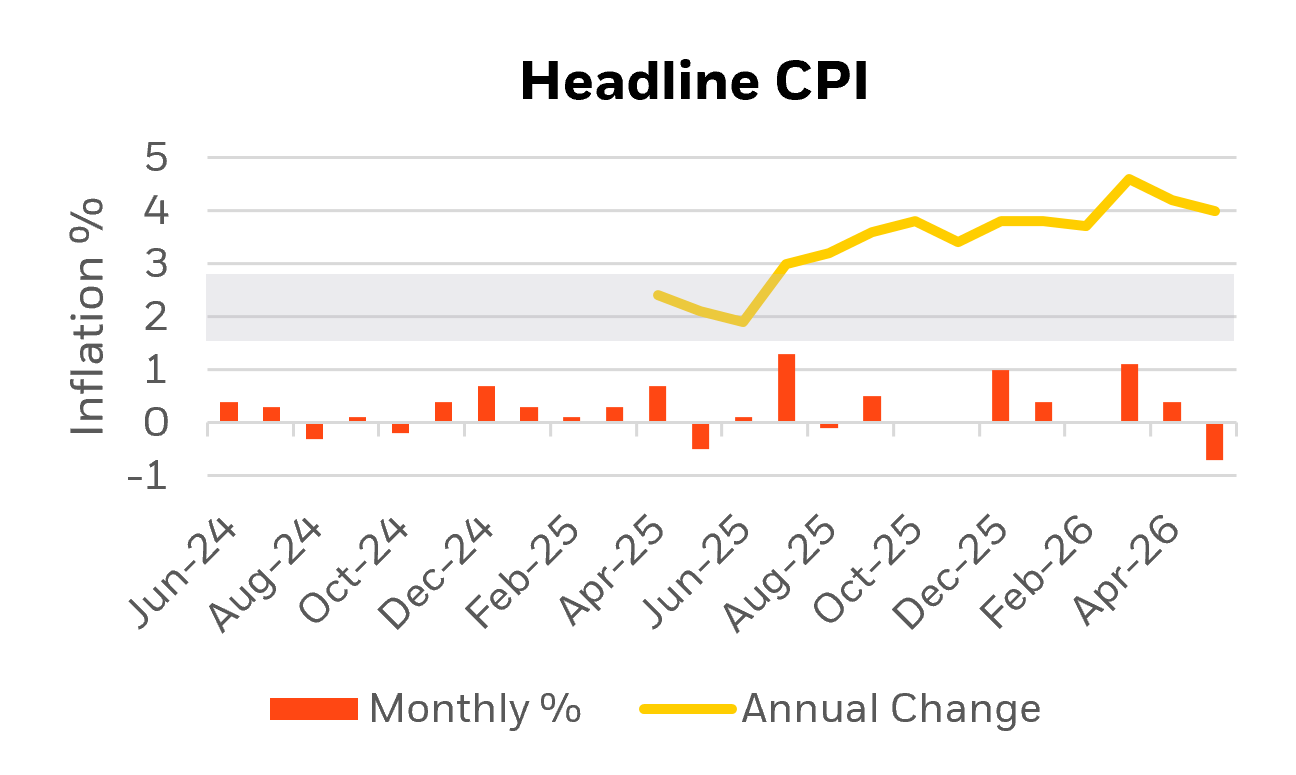
Source: ABS, Bloomberg, BlackRock as of 30/06/2026
-
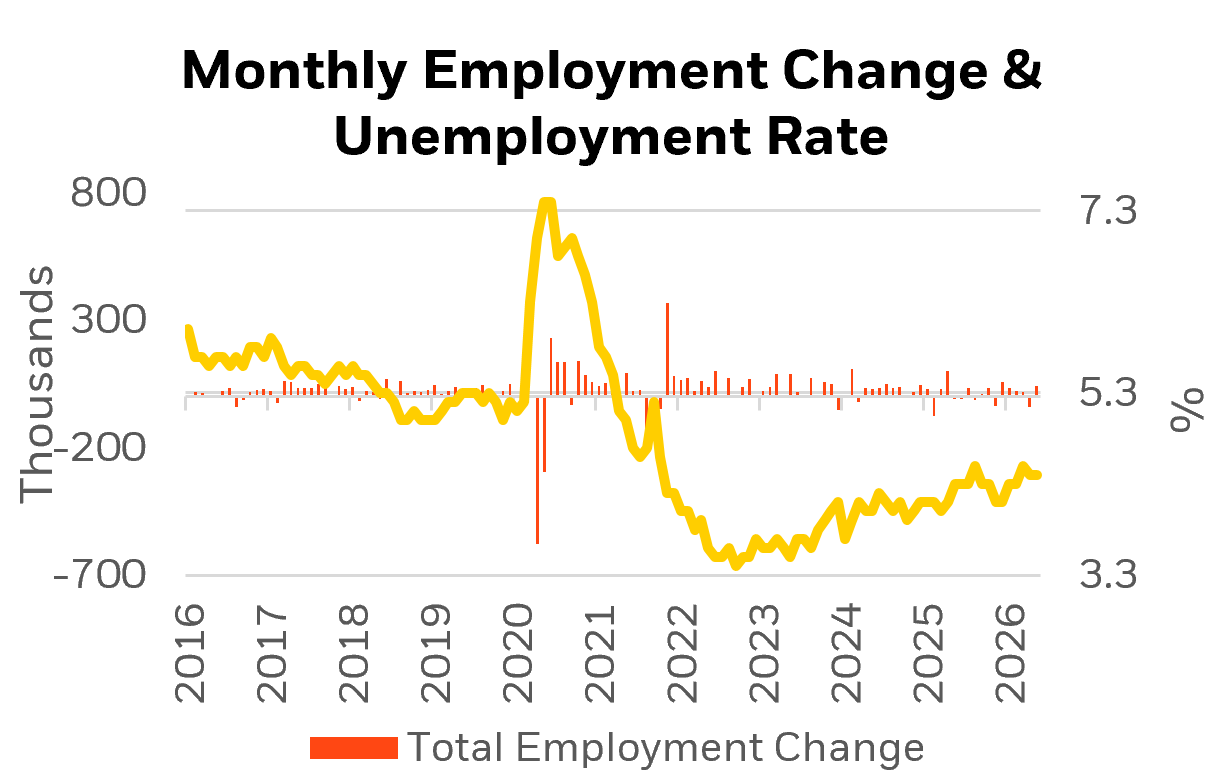
▲ Number of jobs rose by +40.3k in May.
▼ The unemployment rate fell from 4.5% to 4.4%.The Australian labour force survey showed that employment rose by +40.3k in May rebounding after the prior month’s decline which was revised from -18.6k to -40.7k. The result was driven by an increase in both fulltime and part-time by 5.2k and 35.2k respectively. The unemployment rate fell by 10bps from 4.5% to 4.4% with the participation rate little changed at 66.7%. Hours worked fell by -1.1% MoM. The pullback brings hours worked back in line with employment growth. Underemployment (5.8→5.9%) and underutilization (10.3→10.3%) remained at historically low levels.
Source: ABS, Bloomberg, BlackRock as of 30/06/2026
-
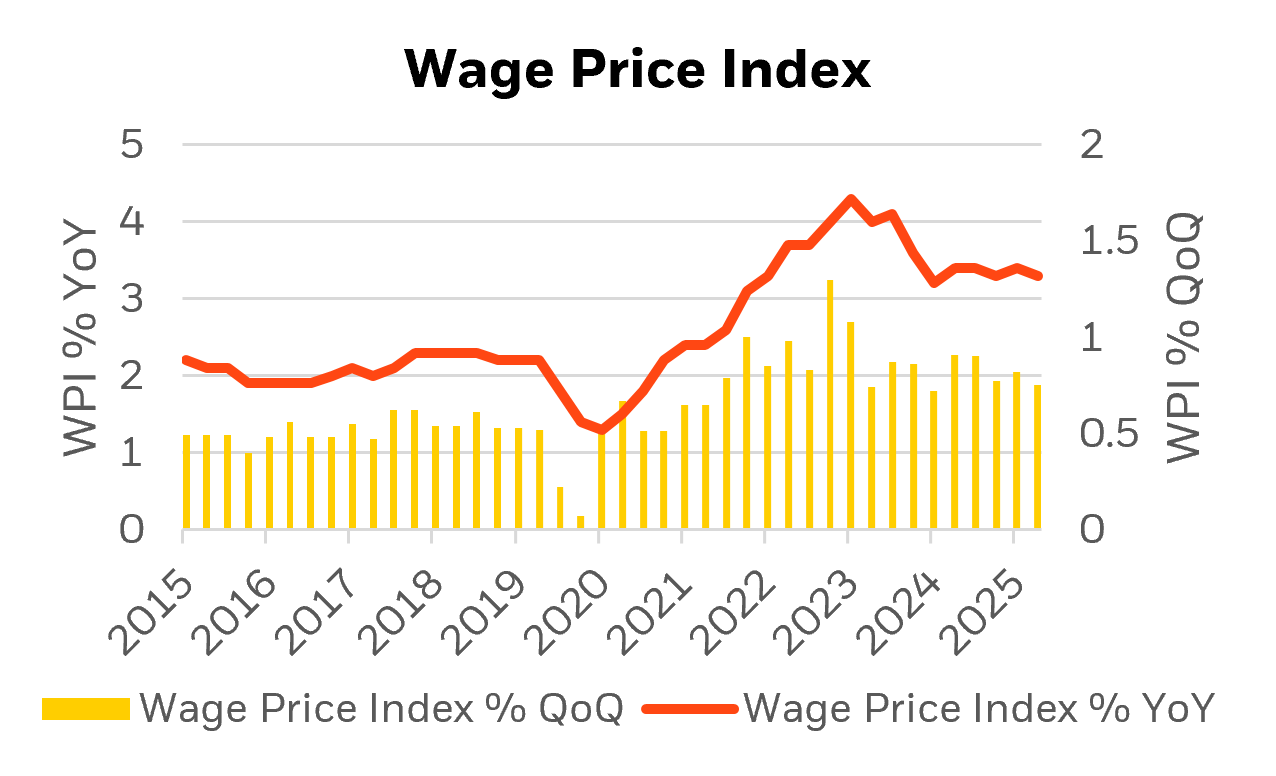
▲ Wages remained steady at 0.8% over Q1
▼ Annual wage growth fell from 3.4% YoY to 3.3 YoYPrivate sector wages rose +0.8% QoQ increasing by 3.2% YoY down from 3.4% YoY in December. Public sector wages showed more moderation increasing by +0.5% QoQ with the annual pace slowing from 4.0% to 3.3%.. By industry, year-ended wages growth decelerated or remained stable in 12 of 18 industries, with the largest decline in health care (-80bp to 3.6% YoY) and education (-70bp to 3.0% YoY). The largest rise was in transport and warehousing (+30bp to 3.5%yoy). The RBA expect wages growth to moderate to 3.2% in next quarter however the FWC decision of 4.75% will put upward pressure on wages in Q3 wages.
Source: ABS, Bloomberg, BlackRock as of 30/06/2026
-
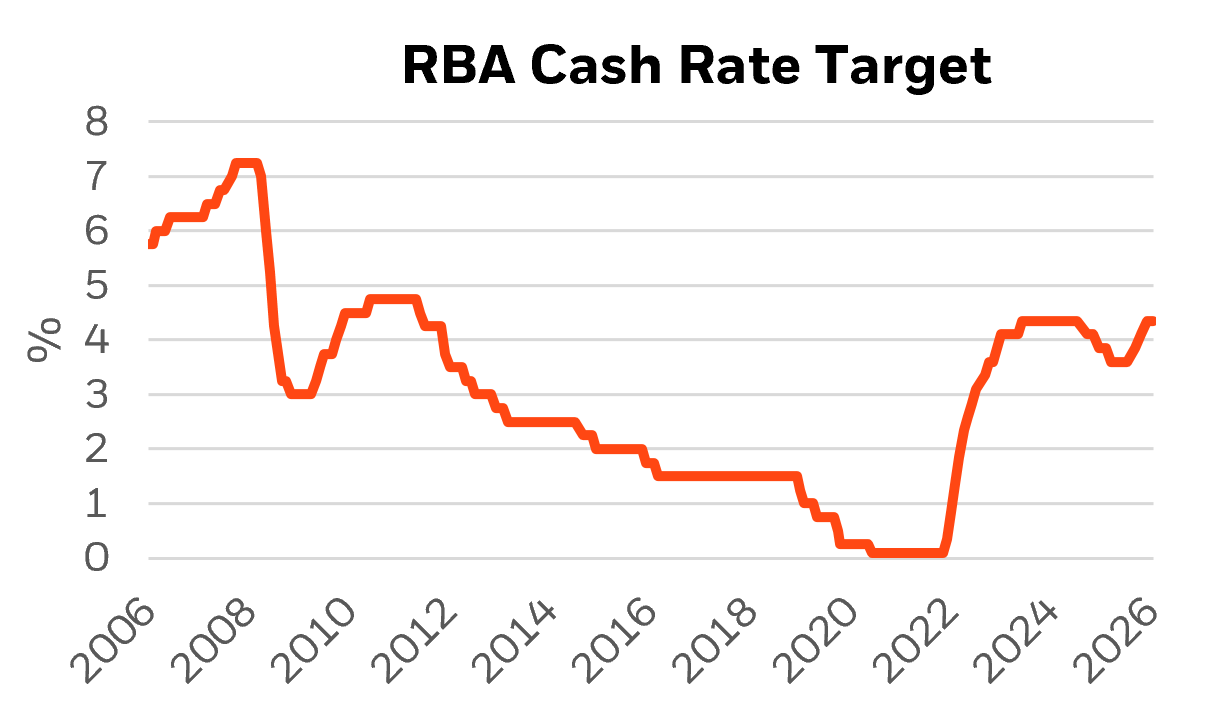
▲ Left the cash rate unchanged at 4.35% in a unanimous decision – its first pause after three consecutive 25bp hikes.
The RBA statement retained an explicit tightening bias, with the willingness to “increase the cash rate target further if required” and remaining focused on ensuring inflation does not become embedded once the oil price impulse passes through. The RBA remains concerned that inflation is proving more persistent than expected, with both headline and underlying inflation remaining above target amid ongoing capacity pressures and higher energy costs. While tighter financial conditions are slowing consumer spending and housing activity, the labour market has remained relatively resilient. Although inflation expectations have eased somewhat, they remain elevated, reinforcing the RBA’s focus on inflation persistence, capacity constraints, and the extent of the economic slowdown.
Source: RBA, Bloomberg, BlackRock as of 30/06/2026
-
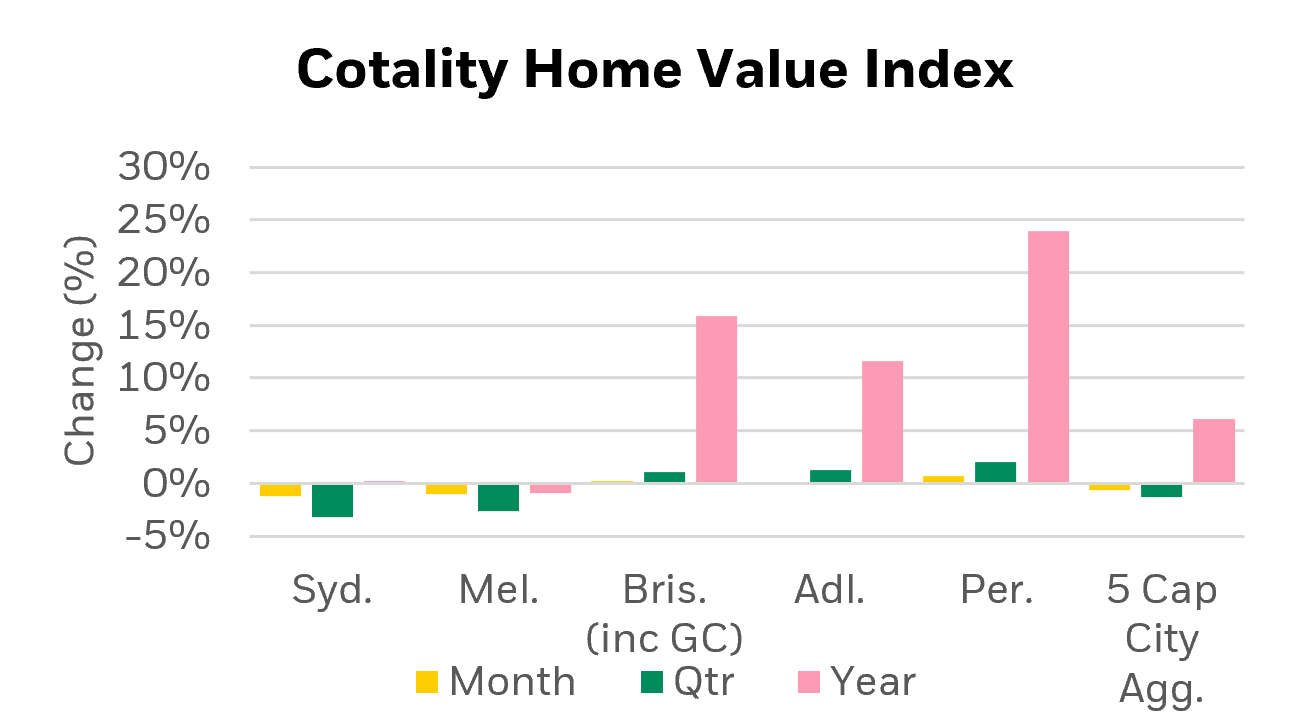
▲ The Cotality national HVI fell by -0.1% in May
▼ The Cotality national HVI slowed to 7.8% YoYGrowth in Australian national home value index (combined capitals) fell by -0.1% in May with the annual rate slowing to 7.8%. Price trends remain divergent, regional areas and smaller capital cities are doing better. Turnover continues to slow, with sales falling -9% YoY and the national auction clearance rate looking to have dropped below 50% - a six-year low. Headwinds to the housing market are growing with the RBA increasing rates for a third time in May. Construction costs are under pressure from the Iran war and tax policy changes for housing investors. Private sector credit in April rose +0.7%mom after a +0.7%mom increase in March, the annual rate fell from 8.1% to 8.0% YoY. Building approvals fell -3.4% in April following a -10.5% fall in March. The annual rate is 10.2% higher than April 2025.
Source: Cotality, BlackRock as of 30/06/2026