VIEWS FROM THE LDI DESK
Completion management
May 2023 | By Lynda Costello
Introduction
Due to the sharp rise in interest rates in 2022, and subsequent decline in liability values, many pension plans have increased in funded status and reached or exceeded full funding. In our estimation, the funded ratio for a typical pension plan increased by approximately 12.5% over 2021 and 2022, per BlackRock’s US Pension Funding Update1 as of 12/31/22.
With interest rates now at higher levels than seen in the past decade, we have seen a sharp increase in the number of conversations with consultants, clients and prospective clients about one single topic: completion management.
What is completion management?
Completion management can be viewed as a natural extension of a pension plan’s LDI journey. Pension liabilities are measured based on high quality corporate bond yields, which are driven by the Treasury yield curve, plus a spread for the corporate credit premium. An LDI portfolio using physical fixed income, benchmarked against market indices, is a solid start toward hedging the liability’s rate risk, but many plan sponsors may eventually find that it’s not a flexible enough framework to achieve their changing goals.
2022 was a case in point. Rates had risen significantly, and plans wanted to hedge more rate risk, without necessarily adjusting their growth / fixed income split. In addition, the yield curve flattened dramatically, and then inverted, with short yields rising above long maturity yields. This created an even stronger desire to ensure better hedging across liability yield curve exposures.
Completion management may be used to fill in the exposure mismatches between a fixed income portfolio’s cashflows and liability cashflows, by using STRIPS, futures, or other capital efficient tools.
Eager to mitigate risk of backtracking to a lower funded status, plan fiduciaries may be looking to remove interest rate risk through completion mandates, specifically seeking the manager to:
- analyze the pension plan’s liabilities and sensitivity to interest rate changes,
- understand the exposures of existing fixed income portfolios and how they compare to the interest rate risk of the liabilities, and
- create a portfolio that strives to meet the preferred interest rate hedge ratio making the most efficient use of capital.
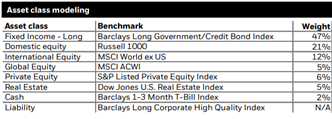
As an example, Exhibit 1 shows the key rate duration profile and accompanying hedge ratios, for an illustrative plan which is 100% funded and holds 50% of its portfolio in long government/credit mandates.
Exhibit 1

Source: BlackRock, for illustrative purposes only as of 12/31/2022. Current Portfolio modeled as 50% BBG Barclays U.S. Long Government/Credit Index. Indices are unmanaged and one cannot invest directly in an index. Liability modeled using a set of generic liability cashflows valued with the Bank of America Merrill Lynch AA-Rated US Corporate Market-Weighted Yield Curve with a duration of 12.7. The limitations of dollar durations are approximate, and result may vastly differ as due to estimations and fluctuation in bond values, rates, and payments and sensitive to interest rates changes. The funded status of the plan is assumed to be 100%. Models are for illustrative purposes only, hypothetical, based on assumptions, and subject to significant limitations. Models should not be relied upon as actual results may vary significantly.
As seen in Exhibit 2, when seeking to achieve the desired 100% interest rate hedge ratio at each interval along the curve without allocating additional assets to the liability hedging portion of the portfolio, the completion manager would implement a rates completion strategy which supplements the existing assets. In doing so, the completion manager leaves the credit exposure in place, and seeks to deliver a 42.9% improvement in overall hedge ratio using capital as efficiently as possible through a custom Treasury portfolio based on the plan’s unique liability benchmark.
Exhibit 2

Source: BlackRock, for illustrative purposes only as of 12/31/2022. Current Portfolio modeled as 50% BBG Barclays U.S. Long Government/Credit Index. Indices are unmanaged and one cannot invest directly in an index. Proposed portfolio consists of 27% Long Credit modeled as BBG Barclays US Long Credit Index, and 23% Extended Duration Treasuries modeled as ICE Levered US Treasury Indices. Liability modeled using a set of generic liability cashflows valued with the Bank of America Merrill Lynch AA-Rated US Corporate Market-Weighted Yield Curve with a duration of 12.7. The limitations of dollar durations are approximate, and result may vastly differ as due to estimations and fluctuation in bond values, rates, and payments and sensitive to interest rates changes. The funded status of the plan is assumed to be 100%. Models are for illustrative purposes only, hypothetical, based on assumptions, and subject to significant limitations. Models should not be relied upon as actual results may vary significantly.
To highlight the potential benefits on plan surplus of this approach, Exhibit 3 and Exhibit 4 show the results of stress testing against parallel and non-parallel rate changes. Specifically, Exhibit 3 depicts the effect when a yield curve is assumed to shift up/down in a parallel fashion by 100bps.
Exhibit 3 – surplus risk scenario – yields move 100 basis points in a parallel shift

Source: BlackRock, for illustrative purposes only as of 12/31/2022. Current Portfolio is represented as $1 billion in asset value with 50% BBG Barclays U.S. Long Government/Credit Index and 50% Equities modeled as MSCI World Index. Proposed Portfolio is represented as $1 billion in asset value that consists of 27% Long Credit modeled as BBG Barclays US Long Credit Index, 23% Extended Duration Treasuries modeled as ICE Levered US Treasury Indices, and 50% Equities modeled as MSCI World Index. Indexes are unmanaged and one cannot invest directly in an index. Liability modeled using a set of generic liability cashflows valued with the Bank of America Merrill Lynch AA-Rated US Corporate Market-Weighted Yield Curve with a duration of 12.7. The limitations of dollar durations are approximated, and result may vastly differ as due to estimations and fluctuation in bond values, rates, and payments and sensitive to interest rates changes. Funded status of the plan is assumed to be 100%. Models are for illustrative purposes only, hypothetical, based on assumptions, and subject to significant limitations. Models should not be relied upon as actual results may vary significantly. Past performance does not guarantee future returns.
Expected volatility calculated using BlackRock Solutions’ Aladdin risk model as of December 31, 2022 using 255 months of constant weighted observations. Each portfolio component is mapped to a broad set of risk factors; the parametric sensitivity to changes in key interest rates, spreads, and other risk factors is calculated for each portfolio component. The parametric exposures are then summed using the appropriate portfolio weights to compute the portfolio’s exposure to systematic market risk factors. BlackRock Solution’s parametric return model then uses the risk factor changes and exposures in the specified time period to estimate the return of the portfolio. No representation is made as to the accuracy or completeness of the scenario analysis shown on this page or the validity of the underlying methodology and are provided for informational purposes only. The scenario analysis should not be misinterpreted as constituting the actual performance of the portfolios nor should they be relied upon in connection with any investment decision relating to any BlackRock fund. All investments involve a risk of loss of capital, and no guarantee or representation can be made that an investment will generate profits or will avoid losses.
Exhibit 4 depicts the effect on the plan surplus when the yield curve is assumed to steepen by 50 bps with the short end of the curve falling by that amount.
Exhibit 4 – surplus risk scenario – curve falls and steepens 50 basis points

Source: BlackRock, for illustrative purposes only as of 12/31/2022. Current Portfolio is represented as $1 billion in asset value with 50% BBG Barclays U.S. Long Government/Credit Index and 50% Equities modeled as MSCI World Index. Proposed Portfolio is represented as $1 billion in asset value that consists of 27% Long Credit modeled as BBG Barclays US Long Credit Index, 23% Extended Duration Treasuries modeled as ICE Levered US Treasury Indices, and 50% Equities modeled as MSCI World Index. Liability modeled using a set of generic liability cashflows valued with the Bank of America Merrill Lynch AA-Rated US Corporate Market-Weighted Yield Curve with a duration of 12.7. The limitations of dollar durations are approximated, and result may vastly differ as due to estimations and fluctuation in bond values, rates, and payments and sensitive to interest rates changes. Funded status of the plan is assumed to be 100%. Models are for illustrative purposes only, hypothetical, based on assumptions, and subject to significant limitations. Models should not be relied upon as actual results may vary significantly. Past performance does not guarantee future returns.
Expected volatility calculated using BlackRock Solutions’ Aladdin risk model as of December 31, 2022 using 255 months of constant weighted observations. Each portfolio component is mapped to a broad set of risk factors; the parametric sensitivity to changes in key interest rates, spreads, and other risk factors is calculated for each portfolio component. The parametric exposures are then summed using the appropriate portfolio weights to compute the portfolio’s exposure to systematic market risk factors. BlackRock Solution’s parametric return model then uses the risk factor changes and exposures in the specified time period to estimate the return of the portfolio. No representation is made as to the accuracy or completeness of the scenario analysis shown on this page or the validity of the underlying methodology and are provided for informational purposes only. The scenario analysis should not be misinterpreted as constituting the actual performance of the portfolios nor should they be relied upon in connection with any investment decision relating to any BlackRock fund. All investments involve a risk of loss of capital, and no guarantee or representation can be made that an investment will generate profits or will avoid losses.
Interest rate movements
Completion mandates are certainly not new; however, they have gained interest and popularity as plan fiduciaries look for ways seeking to mitigate undesired funded status outcomes as the yield curve has shifted, steepened and inverted.
In 2022, we witnessed a sharp increase in interest rates driven by multiple inflationary sources, such as supply chain issues, demographic shifts, pent up demand from the pandemic, and the war in Ukraine. We also witnessed the Federal Reserve increase the Fed funds rate at a historically fast pace to combat these inflationary trends. These economic forces have pushed the, typically steeper, Treasury yield curve into an inverted state.
Exhibit 5 – historical treasury yield curves

Source: Treasury.gov, “Daily Treasury Par Yield Curve Rates”, as of 12/31/2020, 12/31/2021, and 12/31/2022
The current term premium between to 5-year and 30-year Treasury yields are at the lowest in over a decade, as seen in Exhibit 6. Meanwhile, many pension plans are hedging their liabilities with long duration Treasuries and credit instruments, which may mean the plan is overhedged at the long end of the curve. If the yield curve eventually normalizes and resteepens, this could leave plan sponsors with undesired outcomes in terms of their liability hedging program.
Exhibit 6 – treasury yield term premium

Source: BlackRock, Bloomberg, Treasury yield data from 12/31/2012 through 12/31/2022. The figures shown relate to past interest rate yields. Past performance is not a reliable indicator of current or future results.
By implementing hedging instruments across the key rate duration spectrum, a completion manager may help ensure the plan is well hedged against adverse impacts to funded status, especially in an environment where rates and the shape of the yield curve are changing so dramatically.
Now is the time
Regardless of funded status or complexity, we see value in completion management at every stage of a plan’s journey. With a focus on the liabilities and how the existing portfolio is expected to perform, the completion manager helps fill the gaps in the hedging strategy which may otherwise lead to unpleasant surprises in funded status, particularly in a volatile interest rate environment.
For plans that are underfunded, open and accruing, completion management seeks to achieve reduced interest rate risk without shifting return-generating assets to fixed income, potentially enabling a higher expected return on assets (EROA) assumption to be maintained.
For plans that are considering a pension risk transfer or plan termination, a completion manager may mitigate the risk of a drop in current funded status from interest rate and yield curve movements during the approximate 2-year administrative period prior to transfer or termination.
Finally, for plan sponsors that have chosen to keep their fully funded for the long term, completion management is a way to help protect funded status gains and reduce surplus risk so that the plan fiduciaries may help ensure plan participants will receive their benefit payments in future years.
Looking ahead
In 2023, we expect to see continued and increased de-risking from pension plans, with more implementation across all parts of the yield curve. Based on our experience of managing LDI mandates through numerous rate cycles, we believe completion management will accelerate as plans look to protect recent funded status gains at current yields. However, there is not a one-size-fits all approach to reduce risk in pension plans, especially in today’s more volatile rate environment. In our view, plan sponsors need real-time reporting and risk metrics, pension actuarial analysis, alongside the flexibility and expertise to invest across the fixed income spectrum and a deep understanding of derivative markets.