Wei Li
Global Chief Investment Strategist – BlackRock
France's bond turmoil
France’s government bond sell-off shows why the drivers of higher yields matter. We favor select opportunities across sovereign bonds and credit.
Market Backdrop
Tech stocks were under pressure last week over scrutiny on the record pace of the AI buildout. We still favor AI within our neutral stance on U.S. equities.
Week Ahead
Jittery euro-area bond markets will be watching Moody’s decision on France’s credit rating closely. We also eye UK CPI data for a read on global inflation.
Higher bond yields are creating new investment opportunities, as reflected in our move to upgrade U.S. Treasuries last week. Yet the sharp sell-off in French government bonds is a reminder that intensifying competition for capital is putting borrowers under greater scrutiny, making it increasingly important to understand what is driving yields higher and whether investors are adequately compensated for the risks. Selectivity is key in this environment. We favor select opportunities across sovereign bonds and credit.
Fixed income assets yielding over 4%, 2000–26
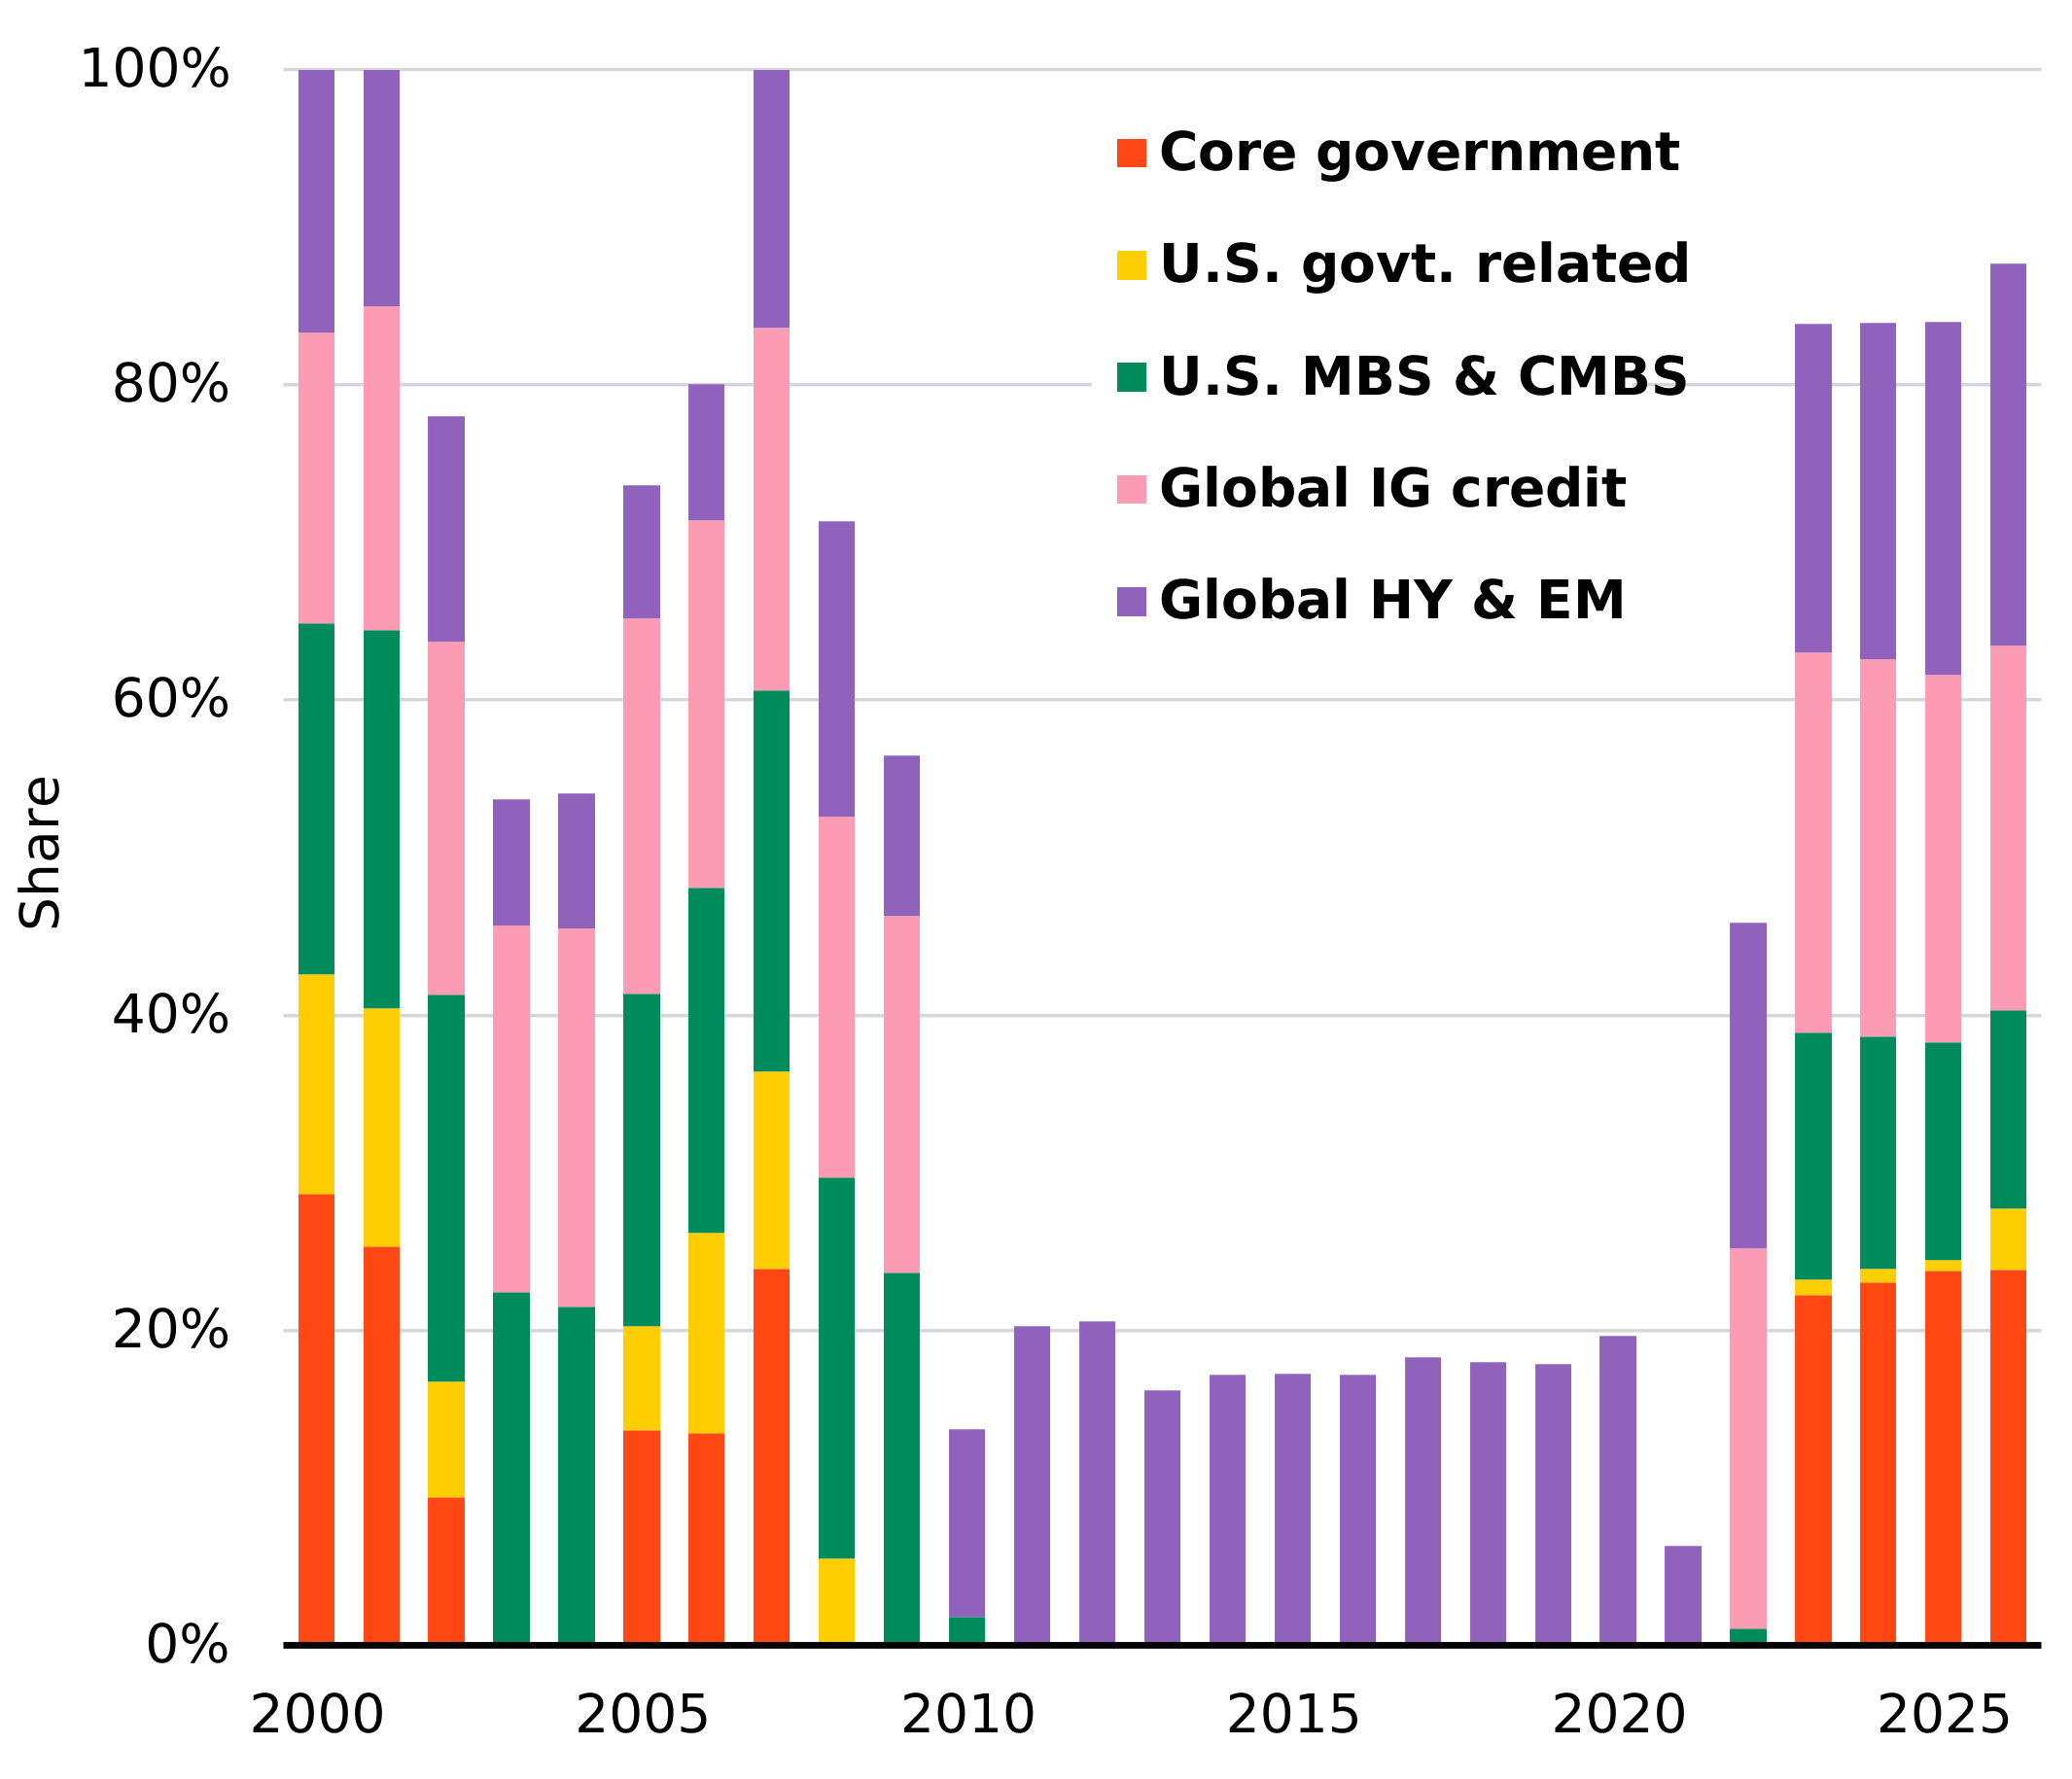
BlackRock Investment Institute, with data from LSEG Datastream, as of September 30, 2026. Note: The bars show market capitalization weights of assets with an average annual yield over 4% in a select universe that represents about 70% of the Bloomberg Multiverse Bond Index, based on annual average yields through 2025 and the latest quarter-end yields for 2026. Euro Core is based on French and German government bonds indexes. Euro periphery is based on an average of government debt indexes for Italy, Spain and Ireland. Emerging markets combine external and local currency debt.
The French bond sell-off illustrates how competition for capital is reshaping fixed income markets amid a global rate reset. Rising government borrowing and AI-related investment are pushing up financing costs, exposing borrowers with deteriorating fundamentals to greater scrutiny. At the same time, higher yields bring more opportunities: more than 80% of global bonds now yield above 4%, versus 6.3% five years ago. See the chart. France shows why selectivity matters across fixed income though. Its 10-year yield has jumped about 100 basis points since early August to nearly 5%, reflecting the broader rate reset. Yet the widening spread over German Bunds shows investors are also demanding additional compensation for France's fiscal and political risks. This underscores why investors need to distinguish between the forces driving yields higher.
Spillover risks from France warrant close attention. But today’s starting point is materially different from that of the 2011-12 euro zone debt crisis. France’s government debt has surged from roughly 89% of GDP in 2011 to around 119% today, while the euro area’s aggregate debt ratio is now back at its 2011 level of around 89%. The region is also better equipped to weather financial stress, with stronger banks and more powerful European Central Bank tools, though intervention isn’t guaranteed. Further volatility and spillovers remain possible. But indiscriminate selling could create opportunities in markets such as Spain, where fundamentals may not justify higher yields. For now, we stay neutral on euro-area government bonds and prefer opportunities elsewhere.
We see opportunities where higher sovereign bond yields better compensate investors for risk without signaling weaker fundamentals. We upgraded U.S. Treasuries as higher starting yields provide a bigger cushion against further rate increases. We also see scope for markets to unwind excessive Fed tightening expectations. Japan offers a similar example of shifting value. Long-term government bond yields have climbed above 3% and the term premium has normalized, improving the risk-reward balance as much of the yield adjustment we anticipated has now occurred. That prompted us to trim our underweight, even as we expect further upward pressure on yields as monetary policy normalizes. We favor emerging market local-currency debt, particularly in Latin America, where improving fundamentals and finances support attractive yields. Across fixed income, we see a rise in term premium, particularly if driven by fiscal concerns, as a key risk that could push yields higher.
The same selectivity extends to corporate bonds. We favor a reverse barbell approach, seeking attractive income in higher-rated high-yield bonds while avoiding risks at either end of the credit spectrum. Heavy AI-related issuance is putting pressure on investment-grade bonds, while the weakest borrowers face greater refinancing challenges as rates stay elevated. Higher yields mean investors no longer need to reach as far down the credit spectrum for income.
France’s government bond selloff comes amid intensifying competition for capital that’s prompting investors to take a closer look at the source of higher yields. We favor select sovereign bonds and credit.
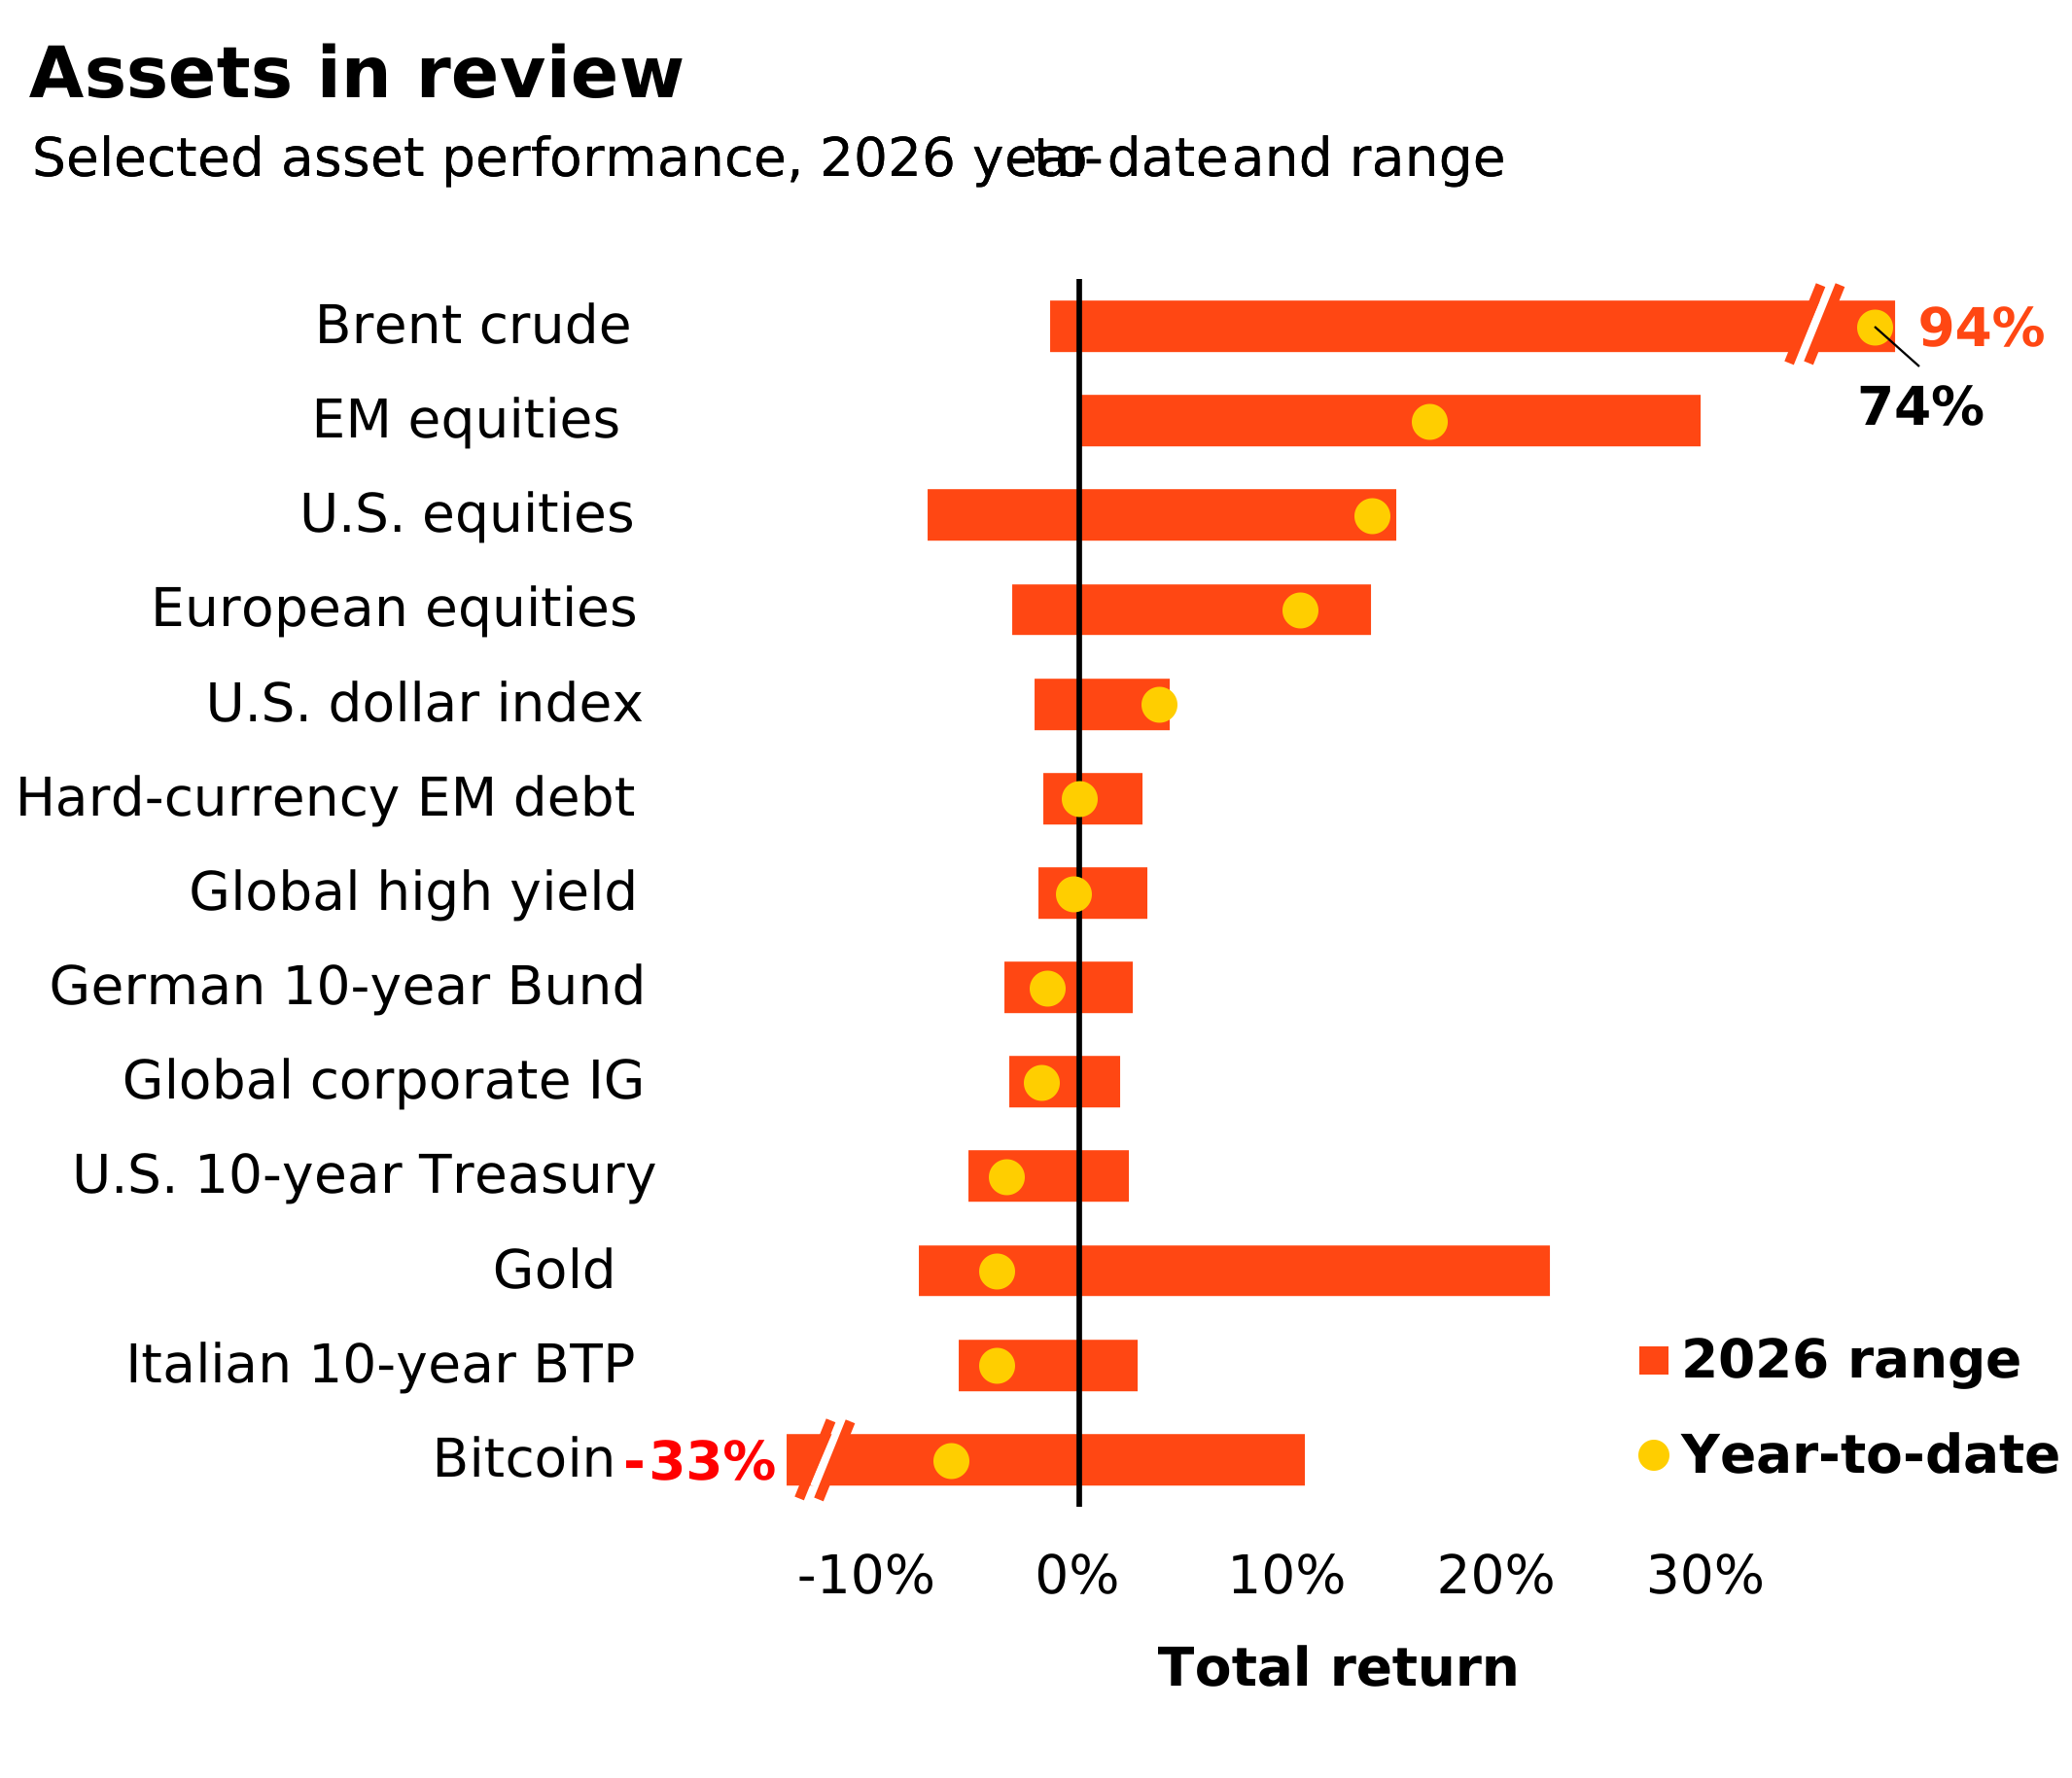
Concerns over surging AI-driven capital spending weighed on tech stocks last week. The S&P fell 2% while the Nasdaq slumped nearly 5%. U.S. 10-year Treasury yields briefly touched 5.34% after a hot September CPI print before retreating during the tech sell-off, though they remained up on the week. These moves reflect two key questions hanging over markets: the outlook for interest rates and the pace of the AI buildout. We still favor AI within our neutral stance on U.S. equities.
We look toward a fresh reading on UK price pressures after the latest U.S. inflation report suggested price pressures remain broad-based rather than driven solely by energy costs. UK data may reveal whether those pressures are broadening beyond the U.S. We are also closely watching Moody’s scheduled review of France’s credit rating as investors assess the country’s fiscal challenges and whether they have broader implications for the euro area.
Oct. 20
UK unemployment
Oct. 21
UK CPI & PPI; Japan trade balance
Oct. 22
Euro-area flash consumer confidence
Oct. 23
Global flash PMI; Japan CPI; Moody’s France sovereign credit rating decision
Read our past weekly market commentaries here
Since we launched our mega forces framework, it has become clearer how their intersection shapes almost all our investment views and opens up alpha opportunities. They cut across asset class labels, spurring a rethink of portfolio construction. Investors need to be deliberate about the economic or thematic exposures they own, the vehicles they use to implement them and their investment horizons.
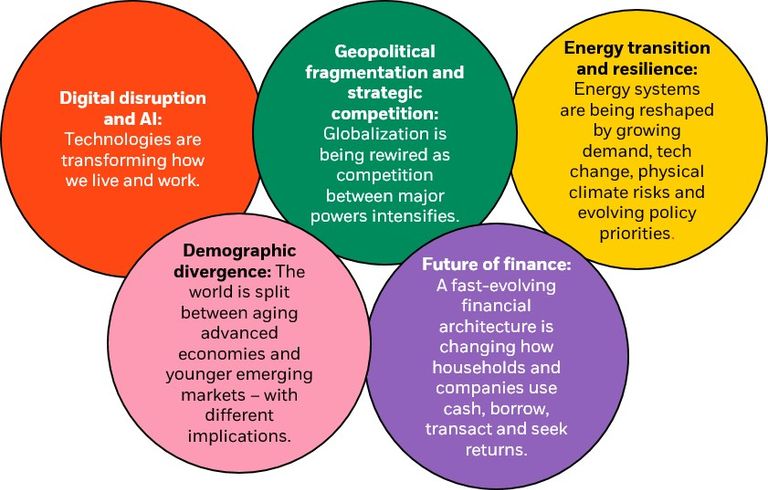
Our highest conviction views, October 2026
Note: Views are from a U.S. dollar perspective, October 2026. This material represents an assessment of the market environment at a specific time and is not intended to be a forecast of future events or a guarantee of future results. This information should not be relied upon by the reader as research or investment advice regarding any particular funds, strategy or security.
Six- to 12-month tactical positioning, October 2026
This shows the implementation of our key investment views from the previous page through an asset class lens.

Past performance is not a reliable indicator of current or future results. It is not possible to invest directly in an index. Note: Views are from a U.S. dollar perspective. This material represents an assessment of the market environment at a specific time and is not intended to be a forecast or guarantee of future results. This information should not be relied upon as investment advice regarding any particular fund, strategy or security.
Six to 12-month tactical views on selected assets vs. broad global asset classes by level of conviction, October 2026
We have lengthened our tactical investment horizon back to six to 12 months. The table below reflects this and, importantly, leaves aside the opportunity for alpha, or the potential to generate above-benchmark returns – especially at a time of heightened volatility.
Past performance is not a reliable indicator of current or future results. It is not possible to invest directly in an index. Note: Views are from a euro perspective, October 2026. This material represents an assessment of the market environment at a specific time and is not intended to be a forecast or guarantee of future results. This information should not be relied upon as investment advice regarding any particular fund, strategy or security.

Stay informed on our latest weekly Market take. Listen wherever you get your podcasts.