Introduction
In the recent higher interest rate environment, improved pension funding levels, and persistent volatility, we believe plan sponsors and consultants are turning to cashflow matching that seeks to maintain liquidity, hedge plan funded status, and directly align assets with future benefit payments. Cashflow matching, one of the original forms of liability hedging, involves structuring bond portfolios whose coupon and principal payments correspond to plan obligations. The approach may help support meeting payments, reducing funded status volatility, and potentially generating outperformance relative to liability growth rates. Implementation vehicles can span Treasuries, corporate bonds, securitized assets, private placements, and direct loans.
Current State of the Market and Pension Plans
With the increase in interest rates from 2022 to 2025, yields may present conditions more supportive of cash-flow matching than may have been seen four years ago . Additionally, for pension plans in an overfunded position, market volatility may present a context in which increasing hedge exposure could help manage funded-status variability and may support future benefit payments. Cashflow matching may be a consideration for a variety of pension plan types with different implementations and objectives. Some of the types of plans and their unique considerations are introduced below.
The average corporate pension plan is currently in an overfunded state after years of underfunding1. With the lessons learned from the prior two decades of funded status volatility, we believe plan sponsors have been eager to maintain their plans’ higher funded status. We see plans that have implemented liability driven investment approaches using long duration fixed income assets. Some plans have also begun to use cashflow matching as a tool that seeks to more directly match benefit payments up to 30 years in the future.
Public pension plans, or mature corporate plans that have closed to new participants or have frozen future benefit accruals, may have a negative cashflow profile, meaning the plan could be paying out more assets in benefit payments than it is collecting in contributions. This consistent need for cash outlay creates an acute awareness of portfolio liquidity and a heightened sensitivity to market downturns, where the possibility of the forced selling of distressed assets may be required to pay monthly benefit payments. Cash flow matching for near-term benefit payments is intended to provide liquidity to meet those obligations, which may help reduce reliance on the sale of other portfolio assets during periods of market stress.
Some severely underfunded Taft Hartley plans received a cash injection from in the special financial assistance (SFA) program under the American Rescue Plan Act of 2021. The goal of the SFA funds is to ensure that the participants of these multiemployer pension plans receive their earned pensions for as many years as possible. Therefore, one of the stipulations for plans to receive the additional funds is that they are required to invest at least two-thirds of the funds in investment grade fixed income assets.2 Cashflow matching has become a popular strategy within these plans as they seek to balance the dual mandate of paying benefit payments and attempting to outearn the plan’s liability in an effort to extend the solvency of the plan.
Considerations When Building a Cashflow Matching Strategy
When building a cashflow matching portfolio, the goal is to match future expected bond coupon and principal payments to expected future participant benefit payments. However, there are many factors to consider when building a bond portfolio, specifically the type of bonds to be included in the portfolio. The range of bonds can include Treasuries, corporate credit, securitized assets and private debt.
A cashflow matching portfolio tends to be a buy-and-hold bond portfolio that will roll down over time until the payment of the principal at the end of a bond’s term. Turnover is limited, therefore the composition of the portfolio at each year of the portfolio becomes critical. As the bonds roll down each year and are paid out, it might be a consideration that the underlying bonds be uniformly diversified within each year in terms of Treasuries vs credit and in terms of quality and sector breakdown. An illustration of a hypothetical portfolio with balanced credit quality can be seen in Illustration 1.
Another important consideration given the limited turnover of the portfolio is the risk of credit defaults. Even though it does not eliminate the risk of credit defaults, ensuring that the bond manager creating the portfolio has capabilities in researching and selecting all types of credit bonds, as well as monitoring them over time, is an important factor.
Finally, it is important to consider the provisions of the pension plan and the liability cashflow profile of the plan. Projected benefit payments are based on underlying demographic assumptions such as retirement age and probability of death, as well as form of payment. Lump sum provisions, a large active population, or cost of living increases can exacerbate the uncertainty of the benefit payment projections, with longer term benefits often more uncertain than near term benefits.
Illustration 1: Sample Cashflow Matching Portfolio by Credit Quality
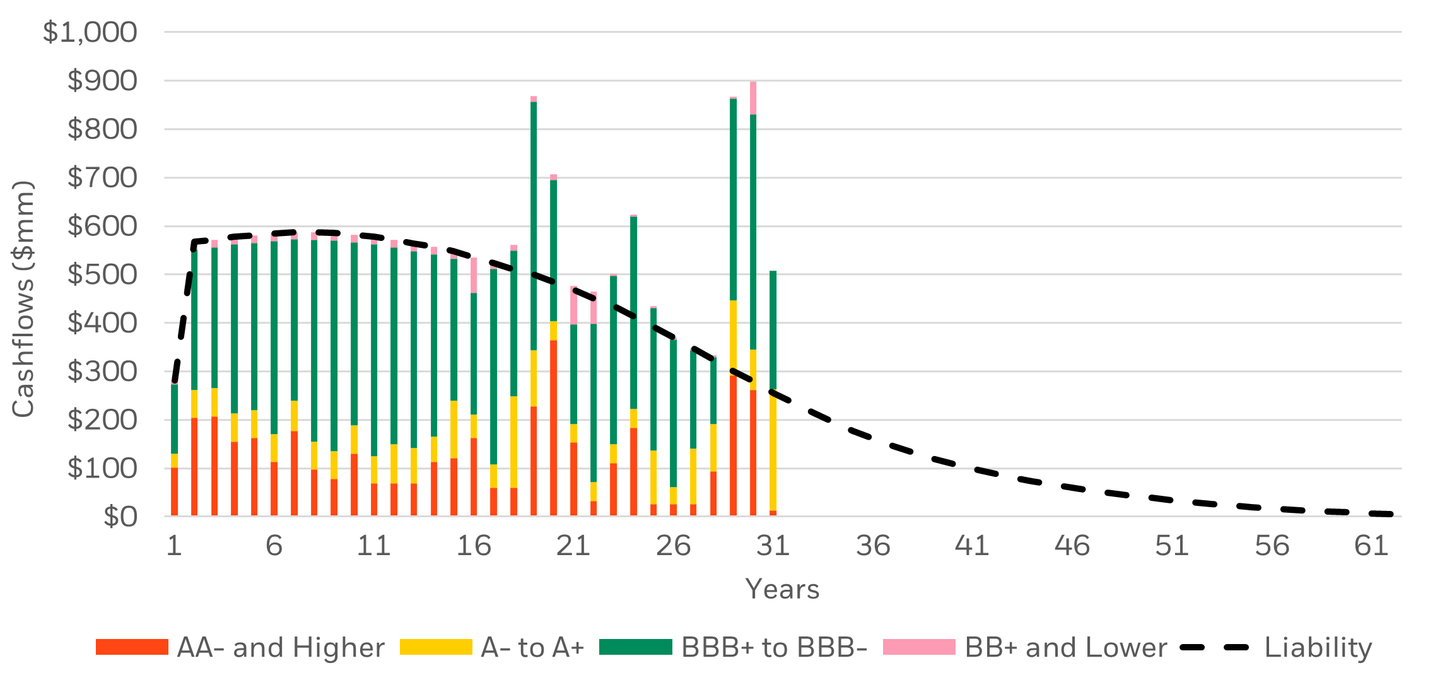
Source: BlackRock. For illustrative purposes only. Not representative of an actual portfolio or client account, nor is this investment advice. Sample liability profile with a duration of 10.1 years and $8.0 Bn in Market Value. Sample portfolio consisting of 74% corporate bonds, 25% government and 1% ABS. Illustrative liability-matching example showing credit quality distribution, not performance or return data. Credit quality refers to the average credit rating as published by the three major rating agencies: S&P Global Ratings, Moody’s Investors Service, and Fitch Ratings. Credit ratings are opinions of the relative credit risk of entities, credit commitments, or debt obligations.
Comparison of Duration Matching and Cashflow Matching
Corporate pension plans often allocate a portion of their assets to reduce the plans’ funded status volatility by implementing hedging strategies that seek to match the duration of the assets in the portfolio to that of the plan’s liabilities, called Liability Driven Investing (“LDI”). The typical LDI approach utilizes a subset of public fixed income asset classes and may also include the use of Treasury futures for further capital-efficient hedging. The cashflows needs of the plan are not typically considered in building this type of strategy, as payments may be sourced from any liquid asset class that is deemed appropriate and cost effective at the time. In addition, although the interest rate risk of the plan is hedged, the equity risk is not. In times of market stress, a plan may be forced to sell distressed assets to pay monthly benefit payments, or there may be liquidity constraints in the market which make selling the asset difficult and/or expensive. In addition, allocations to illiquid assets could become outsized if public equities are the only liquid source of capital to pay benefit payments.
Even though cashflow matching may not be the primary implementation strategy for current LDI portfolios, it could be considered for liquidity purposes for the first 3-10 years of a plan’s cashflows. These benefit payments may be less prone to fluctuation than in the later years of a cashflow projection.
Given the lack of available bonds to meet longer duration (30+ yr) cashflows, implementing a duration matching LDI approach for cashflows longer than 30 years out could be a consideration.
Additionally, there may be more funded status volatility than under a duration matching approach where the overall liability duration is hedged. Bond quality differences can also add to basis risk since AA corporate bonds yields are used as the discount rate for pension accounting liabilities. If the bonds used in the cashflow matching portfolio deviate significantly in quality from AA corporate bonds, there is a higher likelihood that an asset-liability performance mismatch may emerge in the sponsor’s financial reporting.
In both duration matching and cashflow matching, there could be an opportunity cost in terms of potential return on plan assets. By investing in more bonds to add duration and maintain funded status, fewer assets may be available to invest in equities and alternative assets. Utilizing capital efficient strategies, such as Treasury futures, may alleviate this problem as fewer assets may be needed to hedge the liability, freeing up assets to be used for return potential.
Cashflow Matching Strategies
Cashflow matching is sometimes considered as one approach to help manage a pension plan’s overfunded status while continuing to meet benefit payment obligations. This type of portfolio construction attempts to mitigate the interest rate and credit spread risk in the cashflow-matched portion of the liability profile, leaving the remaining plan assets to be invested for other purposes by the plan sponsor.
Illustration 2: Sample Cashflow Matching Portfolio Hedging 100% of Liability DV01
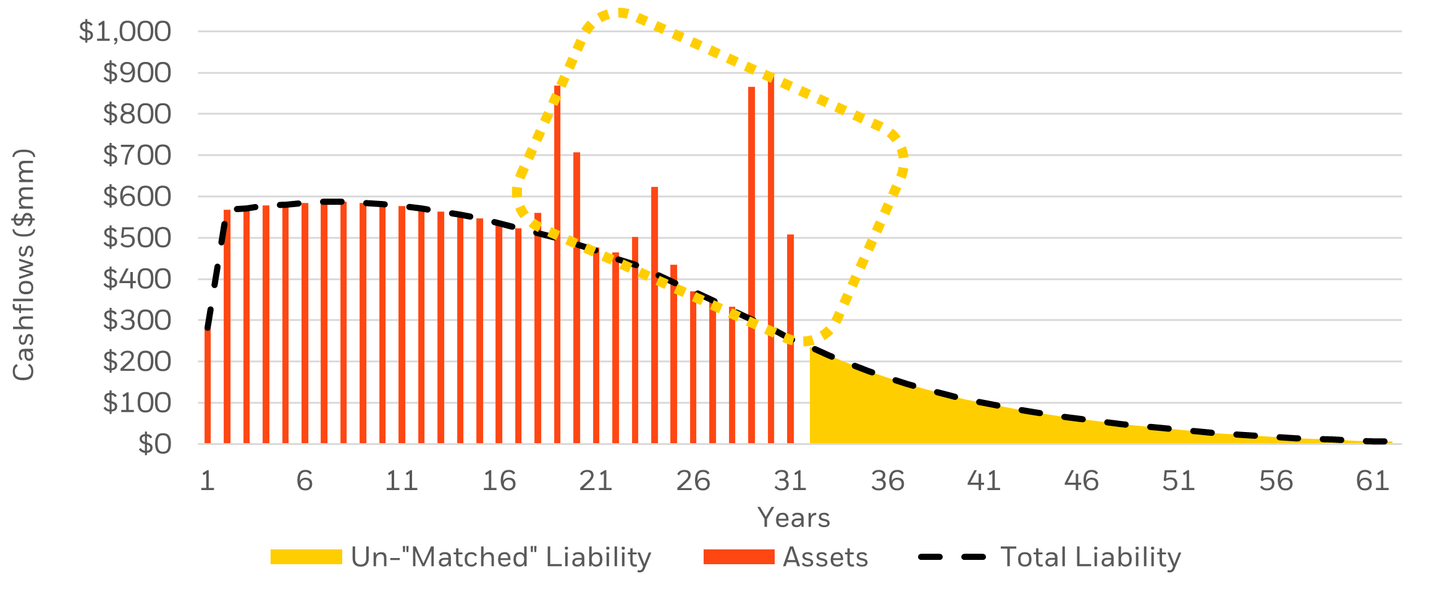
Source: BlackRock. For illustrative purposes only. Hypothetical example that is not representative of any actual client portfolio, returns or result, nor is this to be considered investment advice. Sample liability profile with a duration of 10.1 years and $8.0 Bn in Market Value. Sample portfolio consisting of 74% corporate bonds, 25% government and 1% ABS.
Meanwhile, underfunded plans may not have sufficient assets to match future benefit payments. Given that assets may serve both a liability hedging role and a return-seeking role, depending on plan objectives, the cashflow matching pool may be a small percentage of total plan assets. In the case of underfunded plans, a cashflow matching portfolio could be structured to match a percentage of each year’s benefit payments over many years, or instead, the cash flow matching pool could be structured to match only the earlier years of benefit payments until the pool is exhausted. A hypothetical example of this approach is shown in Illustration 3. Depending on the implementation, it is possible that market risk may be hedged for either a proportion of the benefit payments or for a specific near-term period.
Illustration 3: Sample Cashflow Matching Portfolio of Near-Term Benefit Payments
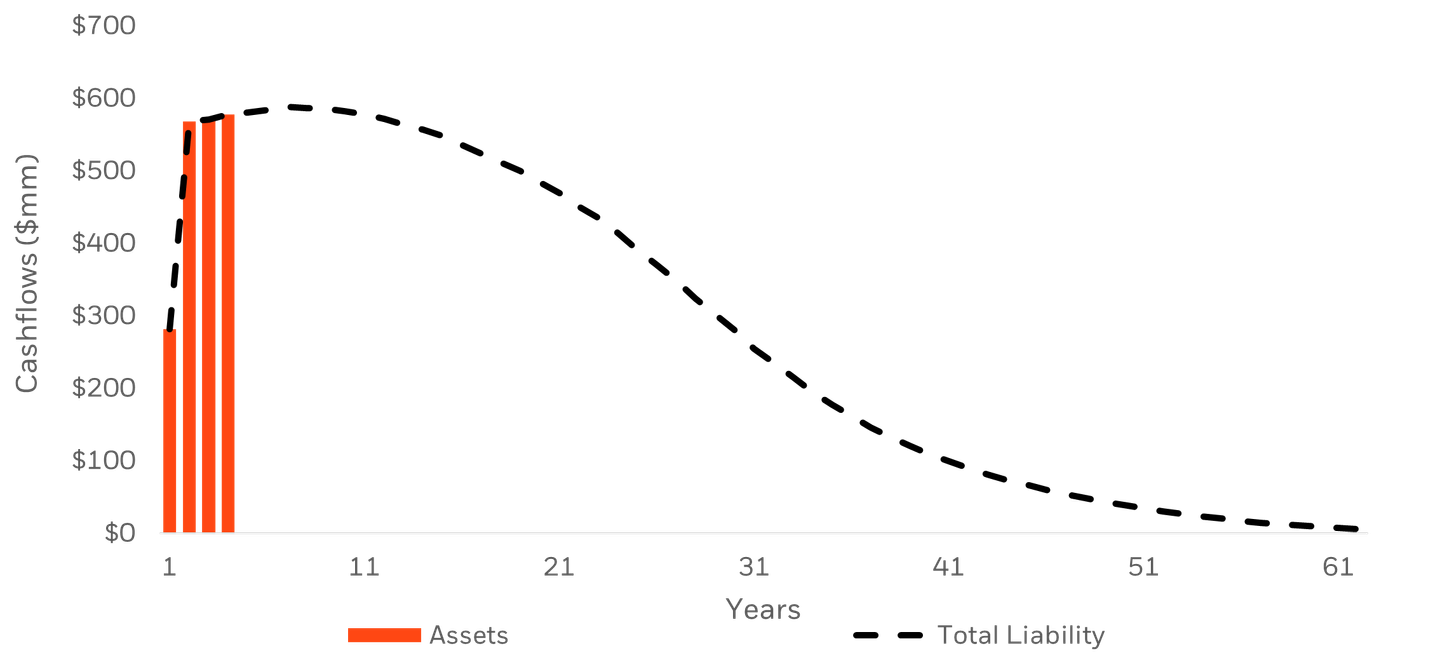
Source: BlackRock. Sample liability profile with a duration of 10.1 years and $8.0 Bn in Market Value. Sample portfolio consisting of 69% corporate bonds, 31% government and agency bonds. For illustrative purposes only. Hypothetical example that is not representative of any actual client portfolio, returns or results, nor is this to be considered investment advice .
Conclusion
Pension plans must manage cashflow demands, funded status volatility, and investment risk from both interest rates and equity markets. A combination of cashflow matching, duration matching and return seeking assets could be considered when managing the competing priorities of pension assets. Actively managing and overseeing these portfolios as they mature can assist pension plans in managing liquidity events, addressing potential credit defaults, and mitigating funded status volatility.
1 Source: BlackRock US LDI Pension Market Watch as of 12/31/2025. Average PBO Funded Ratio is an average of the top 200 U.S. Corporate Pension plans by size based on 10-K data as of 12/31/2024.
2 https://www.pbgc.gov/sites/default/files/sfa/factsheet.pdf dated July 6, 2022
THE INFORMATION CONTAINED HEREIN MAY BE PROPRIETARY IN NATURE, AND MAY NOT BE REPRODUCED, COPIED OR DISTRIBUTED WITHOUT THE PRIOR CONSENT OF BLACKROCK, INC. ("BLACKROCK").
The material is for information purposes only. It is not intended for and should not be distributed to, or relied upon by, members of the public.
Capital at risk. All financial investments involve an element of risk. Therefore, the value of the investment and the income from it will vary and the initial investment amount cannot be guaranteed.
Stock and bond values fluctuate in price so the value of your investment can go down depending upon market conditions. The two main risks related to fixed income investing are interest rate risk and credit risk. Typically, when interest rates rise, there is a corresponding decline in the market value of bonds. Credit risk refers to the possibility that the issuer of the bond will not be able to make principal and interest payments.
Reliance upon information in this material is at the sole risk and discretion of the reader. The material was prepared without regard to specific objectives, financial situation or needs of any investor.
Past performance is not a reliable indicator of current or future results. Asset allocation and diversification strategies do not guarantee profit and may not protect against loss.
Any reference herein to any security and/or a particular issuer shall not constitute a recommendation to buy or sell, offer to buy, offer to sell, or a solicitation of an offer to buy or sell any such securities issued by such issuer.
Forward Looking Information
This material may contain "forward-looking" information that is not purely historical in nature. Such information may include, among other things, projections, forecasts, estimates of yields or returns, and proposed or expected portfolio composition. Moreover, where certain historical performance information of other investment vehicles or composite accounts managed by BlackRock, Inc. and/or its subsidiaries (together, "BlackRock") has been included in this material and such performance information is presented by way of example only. No representation is made that the performance presented will be achieved, or that every assumption made in achieving, calculating or presenting either the forward-looking information or the historical performance information herein has been considered or stated in preparing this material. Any changes to assumptions that may have been made in preparing this material could have a material impact on the investment returns that are presented herein by way of example.
This material is not intended to be relied upon as a forecast, research or investment advice, and is not a recommendation, offeror solicitation to buy or sell any securities or to adopt any investment strategy. The opinions expressed may change as subsequent conditions vary. The information and opinions contained in this material are derived from proprietary and nonproprietary sources deemed by BlackRock to be reliable, are not necessarily all inclusive and are not guaranteed as to accuracy. There is no guarantee that any forecasts made will come to pass. These materials are being provided for informational purposes only and are not intended to constitute tax, legal or accounting advice.
THIS MATERIAL IS HIGHLY CONFIDENTIAL AND IS NOT TO BE REPRODUCED OR DISTRIBUTED TO PERSONS OTHER THAN THE RECIPIENT.
© 2026BlackRock, Inc. or its affiliates. All Rights Reserved. BLACKROCK is a trademark of BlackRock, Inc. or its affiliates. All other trademarks are those of their respective owners.
LDI0526-5477774-EXP0527