Elizabeth Perry, CFA
Director, Client Portfolio Manager
2025 so far has been characterized by risk market performance, steeper yield curves and spread curve flattening.
Treasury yields have remained rangebound in 2025, staying far above the levels seen in fall 2024, with most of the movement in the front end, as rate cut expectations have fluctuated between one and four cuts for 20251 .
Signs of labor market weakness and cooling services inflation gave the Fed room to cut 25bps on September 17th 2025, the first cut since December 20242. Concerns over inflation faded as the Fed saw that the impact of tariffs may be short lived, and concerns over employment risks became the focus.
The front-end of the yield curve is typically driven by anticipated central bank rate cut actions. We started 2025 with 45bps rate cuts priced into the market for 2025 and 47bps for 20263. Currently, after the 25bp cut in September, the market still has two more cuts priced in for the rest of 2025 and another 145bps of cuts predicted for 20253, a dramatic shift from where we were at the beginning of the year. With increased expectations of a rate cut, in September 2025, we saw new lows YTD in 2year yields, where they reached levels not sustained since 20224. In 2025, the 2year treasury yield has moved lower by 68bps4.
In contrast, long end treasury yield levels are typically driven by longer term inflation expectations, the Federal budget and term premium. The 30yr treasury yield was slightly higher through August, before a rally into September, taking it 14bps lower on the year4. This has led to a dramatic curve steepening with the 2s30s moving from 64bps to 114bps throughout 20254.
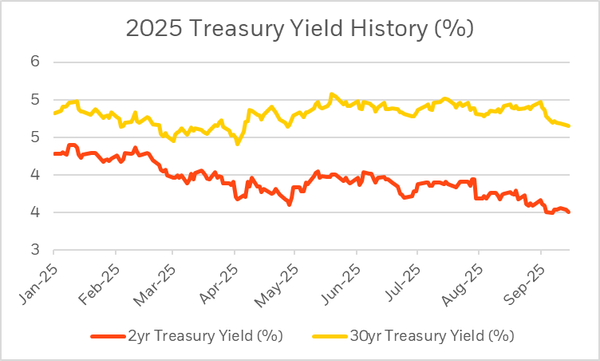
Source: FRED as of 9/16/25
For illustrative purposes only. Past market data is not indicative of future results.
These moves in the shape of the yield curve have been notable for LDI investors as many pension plans typically focus on overall duration hedge, typically buying longer duration assets due to their capital efficiency. We encourage clients to be mindful of key-rate duration exposure and to consider a custom LDI program to match the liability not just at an overall DV01 level, but also across maturity buckets.
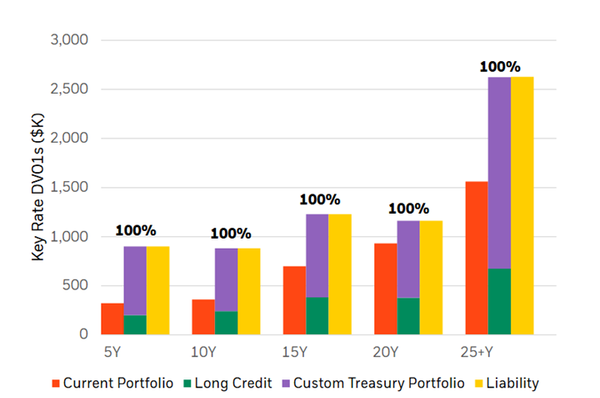
Source BlackRock as of 9/16/25
For illustrative purposes only
Current Portfolio modeled as 50% BBG Barclays U.S. Long Government/Credit Index. Indices are unmanaged and one cannot invest directly in an index. Proposed portfolio consists of 27% Long Credit modeled as BBG Barclays US Long Credit Index, and 23% Extended Duration Treasuries modeled as ICE Levered US Treasury Indices, without allocating additional assets to the liability hedging portion of the portfolio. Liability modeled using a set of generic liability cashflows valued with the Bank of America Merrill Lynch AA-Rated US Corporate Market-Weighted Yield Curve with a duration of 12.7. The limitations of dollar durations are approximate, and result may vastly differ as due to estimations and fluctuation in bond values, rates, and payments and sensitive to interest rates changes. The funded status of the plan is assumed to be 100%. Models are for illustrative purposes only, hypothetical, based on assumptions, and subject to significant limitations. Models should not be relied upon as actual results may vary significantly.
Another notable trend in 2025 has been tightening corporate credit spreads. Corporate credit spreads have been remarkably resilient, experiencing very strong technicals including strong inflows to the asset class, light long end supply, and shortening of duration of new issues, all contributing to a chase for yield in a supply starved market. The long end in particular has benefited, as IG investors look for all-in-yield, which is highest in the long end.
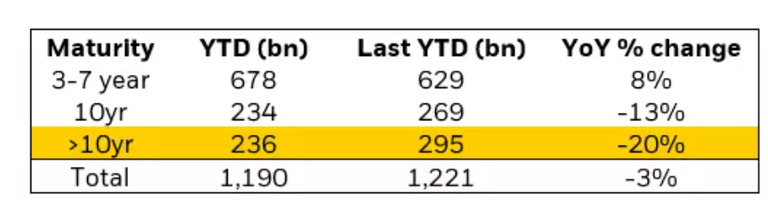
Source: Blackrock. US IG Issuance by maturity bucket as of 09/13/2025
Where rate curve steepening has been observed in the rates market, the credit market has seen the opposite phenomenon. The outperformance of the long end corporate market has led to spread curve flattening, where levels have reached the flattest levels in a decade.
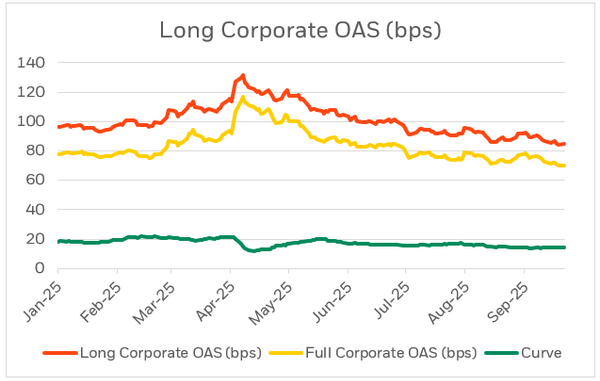
Source: BlackRock, Bloomberg Long Corporate Option Adjusted Spread vs Bloomberg Corporate Option Adjusted Spread, as of 9/16/25
Another positive factor driving the corporate market is that strong technicals have also been coupled with resilient fundamentals. Corporate earnings remain strong with EBITDA growth remaining resilient, and leverage kept under control by limited debt growth. Positive economic growth combined with a relatively low inflation environment is particularly beneficial for corporate fundamentals and supportive of tighter credit spreads. Into Q3 earnings, market participants will look to gain insights into the state of the labor market and any impacts of tariffs flowing through to corporate profit margins.
Looking ahead, technicals remain strong for corporate credit which can keep credit spreads tight despite stretched valuations. Some plans are exploring ways to potentially increase yield and diversify within their credit allocation, such as through adding an allocation to private credit or direct lending.
Diversification does not guarantee a profit or eliminate the potential for loss.
We encourage clients to evaluate their credit spread hedge ratio, in combination with the interest rate hedge ratio, to consider the optimal hedging targets that make sense for their plan. Where plans are limited in capital, it could make sense to prioritize maintaining a higher interest rate hedge ratio vs the credit spread hedge ratio. The optimal credit spread hedge ratio will also likely be dependent on the growth allocation, considering correlation of equity exposures with credit spreads.
2025 has so far been another interesting year in markets. The rates market has exhibited steepening, while the credit market has seen flattening. Risk markets continue to perform well. BlackRock estimates that average funded ratios are up an estimated 2.8% YTD, to 107.7%5For some pension plans, these market moves present opportunities to make a move on the glidepath, such as considering reallocation from growth, or revisiting the LDI hedge targets for both interest rates and credit. BlackRock can offer expertise and analysis to assist clients with these important strategic decisions for their plan, aiming to help achieve the best outcome for plan participants.
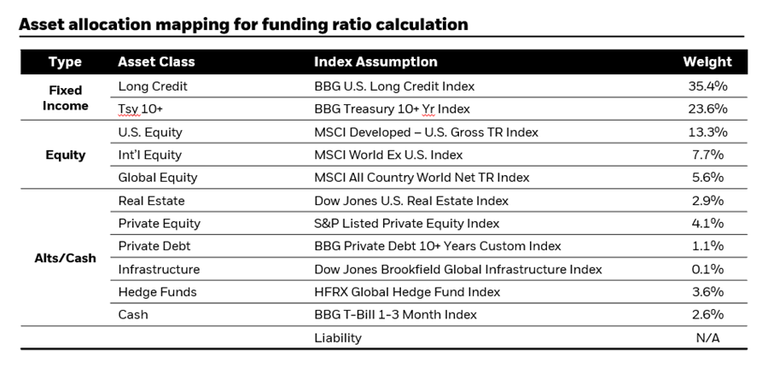
The asset class weights are based on 10-K data from the top 200 public corporate pension plans as of 12/31/2024. The data was sourced using Capital IQ and subsequently aggregated and categorized into asset classes by BlackRock. Using the 10-K asset and liability data sourced by Capital IQ, the funded ratio of the top 200 corporate pension plans was estimated to be 104.89% as of 12/31/2024.
No allowance has been made for active management or costs. Asset returns are based on the historical levels of the indices in the table. Liability returns are based on the historical levels of the Bank of America Merrill Lynch Mature U.S. Pension Plan AAA-A Index. Asset and liability returns are rolled forward on a daily basis based on underlying returns to calculate an estimated funded status for the top 200 plans using the estimated pension asset allocation above. Past performance does not guarantee future returns. An index is unmanaged and one cannot invest directly in an index. Neither asset allocation nor diversification can guarantee profit or prevent loss.

Our LDI platform provides defined benefit plan sponsors with the power and flexibility of one of the most comprehensive fixed income businesses in the world, combined with proprietary asset-liability focused technology.
1Source: Bloomberg as of 9/16/25, Forecasts may not come to pass.
2Source: Federal Reserve.
3Source: Citi STIRT.
4Source: FRED as of 9/16/25.
5Source: BlackRock LDI MarketWatch as of 9/30.
Risk Disclosures:
All investing is subject to risk, including possible loss of money invested. Past performance is not a guarantee of future results. Index performance is shown for illustrative purposes only. Indexes are unmanaged and therefore you cannot directly invest in an index.
Index performance returns does not reflect any management fees or expenses.
General Disclaimers:
This material is not intended to be relied upon as a forecast, research or investment advice, and is not a recommendation, offer or solicitation to buy or sell any securities or to adopt any investment strategy. The opinions expressed are as of October 2025. and may change as subsequent conditions vary. The information and opinions contained in this material are derived from proprietary and nonproprietary sources deemed by BlackRock to be reliable, are not necessarily all-inclusive and are not guaranteed as to accuracy. There is no guarantee that any forecasts made will come to pass. Any investments named within this material may not necessarily be held in any accounts managed by BlackRock. Reliance upon information in this material is at the sole discretion of the reader.
These materials are being provided for informational purposes only and are not intended to constitute tax, legal or accounting advice. You should consult your own advisers on such matters.
FOR INSTITUTIONAL USE ONLY - NOT FOR PUBLIC DISTRIBUTION
© 2025 BlackRock, Inc. or its affiliates. All Rights Reserved. BLACKROCK is a trademark of BlackRock or its affiliates. All other trademarks are those of their respective owners.
LDIH1025U/S-4944870