Our latest research reveals why global macro hedge funds deserve a fresh look—and given the differentiated diversification benefits—can likely play a larger role in sophisticated portfolios.
Global macro matters: smarter macro hedge fund allocations

Key points
01.
Volatility is back
Macroeconomic volatility has returned, driven by inflation, higher interest rates, diverse policy environments and geopolitical risks.
02.
The macro edge
Whether through comprehensive risk management or enhanced diversification, we find that global macro hedge funds may be better positioned to capitalize on the macro opportunity set.
03.
Asymmetric resilience
Global macro hedge funds may excel where others falter— aiming to generate alpha when risk-aversion sidelines other strategies.
Explore the Hidden Strength of Macro Hedge Funds in Today’s Volatile World
Macroeconomic volatility has increased over the last few years as inflation, higher interest rates, global dispersion across policy environments and geopolitical risks have reentered the market. This has led many investors to consider their hedge fund portfolios, and specifically their allocation to the global macro investment style.
Global macro strategies have long been a cornerstone of the hedge fund industry, tracing their origins back to 1980s and 1990s. Despite numerous shifts in market environments and significant evolution in competitive dynamics, we believe the highly diversified role of global macro funds in investors’ portfolios remains unchanged.1 These strategies have consistently proven their value in navigating complex markets, often succeeding when other strategies struggle, thus offering benefits to portfolio construction. Notably, global macro funds outperformed dramatically in 2008, when many hedge funds failed to provide the expected level of portfolio diversification, and again in 2022, when historical correlation between equity and fixed income broke down.2
Among hedge fund strategies, global macro stands out for its scope and flexibility.
This flexibility allows them to capitalize on dislocations across geographies, asset classes and instruments. Additionally, macro strategies generally exhibit no structural factor biases, allowing them to generate a more idiosyncratic return stream over a market cycle.
Allocating to macro hedge funds in a hedge fund portfolio
Hedge fund investors generally aim to construct well-diversified portfolios that not only potentially achieve strong returns but also aim to enhance performance consistency and resilience. In Figure 1, we present the long-term Sharpe ratios of the HFRI fund-weighted index3 alongside its four main subcomponents: HFRI macro, HFRI equity hedge, HFRI event-driven and HFRI relative value. The data illustrates that while HFRI macro has delivered competitive risk-adjusted returns, its performance has lagged some of the other strategies.
Figure 1: Long-term Sharpe ratios of the HFRI fund-weighted index and subcomponents Sharpe ratios by component (fund-weighted): 2000-2025
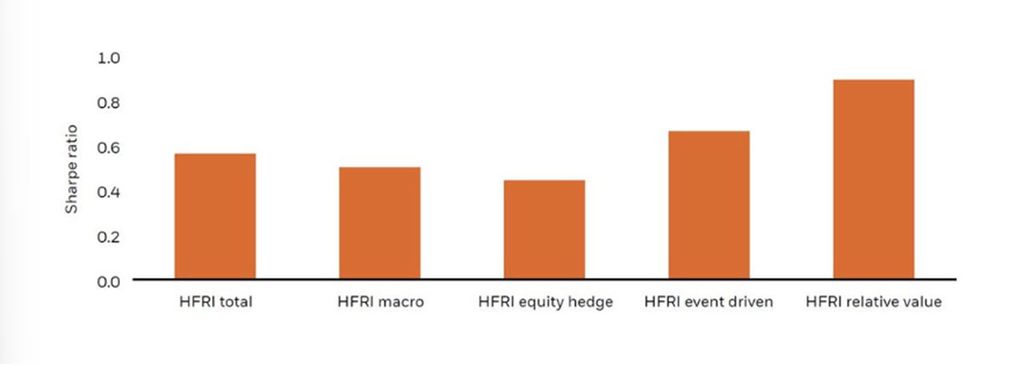
The figures shown relate to past performance. Past performance is not a reliable indicator of current or future results and should not be the sole factor of consideration when selecting a product or strategy.For illustrative purposes only. Source: BlackRock as of December 2025.
While the Sharpe ratio is a useful metric for evaluating hedge fund performance, it only tells part of the story for portfolio constructors. A more nuanced view reveals that macro funds can be additive to other hedge fund categories because of three unique characteristics of the HFRI macro category: Low correlation with other hedge fund strategies, positive skewness and near-zero excess kurtosis, and mean-reverting behavior.4
Firstly, HFRI macro shows the lowest correlations with other HFRI categories, indicating that global macro funds generally move independently of the broader hedge fund returns. As illustrated in the correlation matrices in Figure 2 and Figure 3, this trend is evident both over the entire period and especially during periods of drawdowns. During these times, correlations between global macro and other strategies fall to near-zero levels. This characteristic is particularly valuable for loss-averse investors, as the diversification benefit may help stabilize the overall portfolio, potentially enhancing its resilience to market downturns.
Figure 2: Correlations across HFRI components 2000-2025
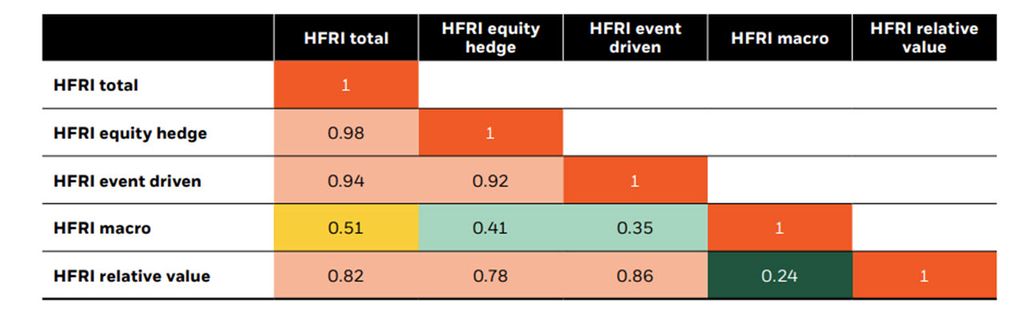
The figures shown relate to past performance. Past performance is not a reliable indicator of current or future results and should not be the sole factor of consideration when selecting a product or strategy.For illustrative purposes only. Source: BlackRock as of December 2025.
Figure 3: Drawdown correlations across HFRI components 2000-2025
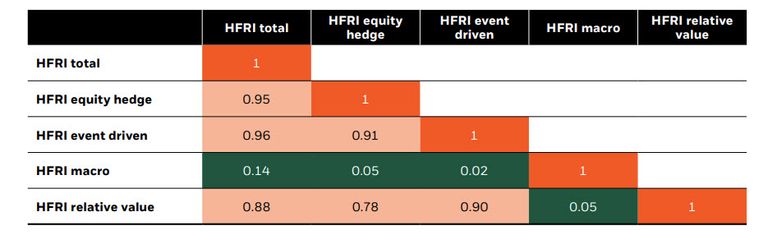
The figures shown relate to past performance. Past performance is not a reliable indicator of current or future results and should not be the sole factor of consideration when selecting a product or strategy.For illustrative purposes only. Source: BlackRock as of December 2025.
Secondly, unlike most hedge fund categories that show negatively skewed distributions and more extreme values (both high and low), global macro funds display defensiveness with positive skewness and fewer extremes.5 This trait can be particularly appealing to risk-averse investors because, unlike negative skewness — which indicates frequent smaller gains and rare but significant losses — positive skewness suggests a higher frequency of smaller losses but more rare larger gains.
Figure 4: HFRI kurtosis and skewness
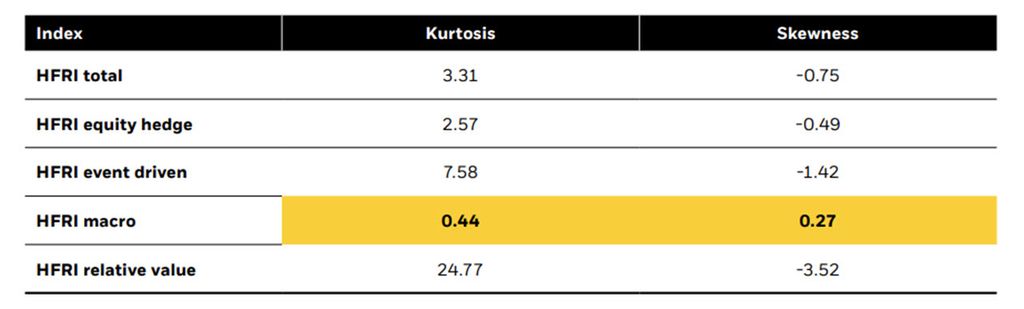
The figures shown relate to past performance. Past performance is not a reliable indicator of current or future results and should not be the sole factor of consideration when selecting a product or strategy.For illustrative purposes only. Source: BlackRock as of December 2025.
Finally, we found that the macro style is mean-reverting, unlike the average hedge fund style. This is supported by Figure 5, which shows auto-regressions on monthly returns, suggesting that unlike most other hedge fund strategies, macro hedge funds typically experience positive performance in the 1-2 months following periods of negative returns.
Figure 5: Auto-regression coefficients on monthly returns
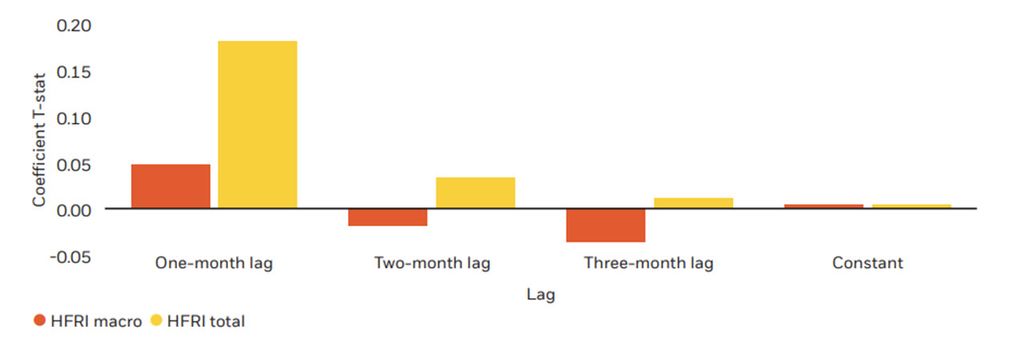
The figures shown relate to past performance. Past performance is not a reliable indicator of current or future results and should not be the sole factor of consideration when selecting a product or strategy.For illustrative purposes only. Source: BlackRock as of December 2025.
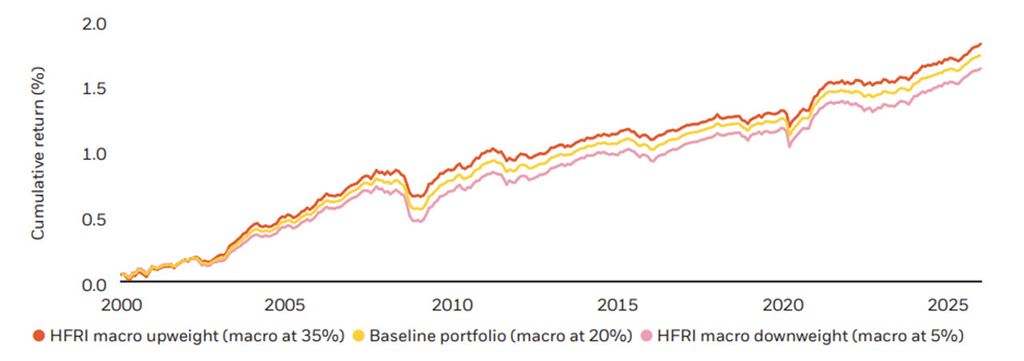
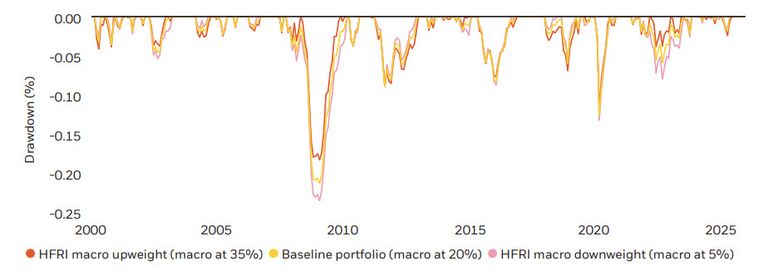
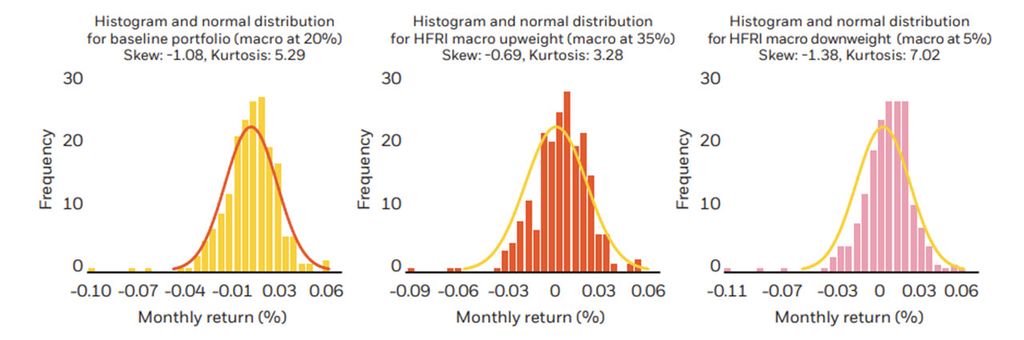
The differentiated characteristics of macro funds provide the basis for an exploration of their benefit in broader hedge fund portfolios. Below we construct three simple portfolios where we alter the weight to the HFRI macro component, maintaining equal allocations across the other three styles equal in the residual allocation.6 As the analysis in Figure 6-8 show, a higher allocation to HFRI macro yields a portfolio with higher Sharpe ratios, shallower drawdowns, and more attractive distributional properties.7
Figure 6: Hedge fund portfolio cumulative returns
The figures shown relate to past performance. Past performance is not a reliable indicator of current or future results and should not be the sole factor of consideration when selecting a product or strategy.For illustrative purposes only. Source: BlackRock as of December 2025. Hypothetical returns are not intended to be indicative of any particular investment or strategy. The hypothetical performance returns are provided for illustrative purposes only and demonstrated index performance and are not meant to be representative of actual performance returns of, or to project or predict returns for, any particular investment and does not exist and therefore does not reflect the deduction of any fees or expenses, including advisory, management and performance fees, as well as brokerage fees, commissions and other expenses that might normally apply. In addition, the allocation decisions reflected in the hypothetical returns were not made under actual market conditions and cannot completely account for the impact of financial risk. The performance shown above is hypothetical and does not represent the investment performance or the actual accounts of any investor(s) or any fund(s). The indices were selected with the full benefit of hindsight, after their performance over the period shown was known. Past hypothetical performance results are not indicative of future returns. The performance shown does not represent any existing portfolio, and as such, is not an investible product. There are frequently sharp differences between a hypothetical performance record and the actual record subsequently achieved. Therefore, hypothetical performance records invariably show positive rates of return. Another inherent limitation of these results is that the allocation decisions reflected in the performance record were not made under actual market conditions and, therefore, cannot completely account for the impact of financial risk in actual portfolio management.
Figure 7: Maximum drawdown of total performance
The figures shown relate to past performance. Past performance is not a reliable indicator of current or future results and should not be the sole factor of consideration when selecting a product or strategy.For illustrative purposes only. Source: BlackRock as of December 2025. Hypothetical returns are not intended to be indicative of any particular investment or strategy. The hypothetical performance returns are provided for illustrative purposes only and demonstrated index performance and are not meant to be representative of actual performance returns of, or to project or predict returns for, any particular investment and does not exist and therefore does not reflect the deduction of any fees or expenses, including advisory, management and performance fees, as well as brokerage fees, commissions and other expenses that might normally apply. In addition, the allocation decisions reflected in the hypothetical returns were not made under actual market conditions and cannot completely account for the impact of financial risk. The performance shown above is hypothetical and does not represent the investment performance or the actual accounts of any investor(s) or any fund(s). The indices were selected with the full benefit of hindsight, after their performance over the period shown was known. Past hypothetical performance results are not indicative of future returns. The performance shown does not represent any existing portfolio, and as such, is not an investible product. There are frequently sharp differences between a hypothetical performance record and the actual record subsequently achieved. Therefore, hypothetical performance records invariably show positive rates of return. Another inherent limitation of these results is that the allocation decisions reflected in the performance record were not made under actual market conditions and, therefore, cannot completely account for the impact of financial risk in actual portfolio management.
Figure 8: Histogram and distribution of returns by macro weight
The figures shown relate to past performance. Past performance is not a reliable indicator of current or future results and should not be the sole factor of consideration when selecting a product or strategy. For illustrative purposes only. Source: BlackRock as of December 2025. Hypothetical returns are not intended to be indicative of any particular investment or strategy. The hypothetical performance returns are provided for illustrative purposes only and demonstrated index performance and are not meant to be representative of actual performance returns of, or to project or predict returns for, any particular investment and does not exist and therefore does not reflect the deduction of any fees or expenses, including advisory, management and performance fees, as well as brokerage fees, commissions and other expenses that might normally apply. In addition, the allocation decisions reflected in the hypothetical returns were not made under actual market conditions and cannot completely account for the impact of financial risk. The performance shown above is hypothetical and does not represent the investment performance or the actual accounts of any investor(s) or any fund(s). The indices were selected with the full benefit of hindsight, after their performance over the period shown was known. Past hypothetical performance results are not indicative of future returns. The performance shown does not represent any existing portfolio, and as such, is not an investible product. There are frequently sharp differences between a hypothetical performance record and the actual record subsequently achieved. Therefore, hypothetical performance records invariably show positive rates of return. Another inherent limitation of these results is that the allocation decisions reflected in the performance record were not made under actual market conditions and, therefore, cannot completely account for the impact of financial risk in actual portfolio management.
Macro Strategies in Portfolio Context
Bringing it all together, macro strategies offer distinct return characteristics that can serve as valuable diversifiers in a portfolio. Today’s leading macro funds increasingly integrate traditional and alternative data sources, harness advanced quantitative tools, and leverage specialized teams with deep market expertise—all within disciplined risk allocation frameworks. This evolution has elevated the importance of manager selection, as the right combination of expertise, infrastructure, and adaptability can make a critical difference in performance.
To explore our framework for hedge fund selection and better understand how macro strategies can complement broader portfolio objectives, download our full research below.
Diversification and asset allocation may not fully protect you from market risk.

Raffaele Savi
Global Head of Systematic – BlackRock

Phil Green
Head of Global Tactical Asset Allocation

Michael Pensky, CFA
Deputy CIO, Portfolio Manager, Global Tactical Asset Allocation

Stephanie Lee
Co-lead Systematic Macro, Portfolio Manager, BlackRock Systematic

Ron Kahn, PhD
Global Head of Systematic Investment Research

Michael Pyle, CFA
Deputy Head of the Portfolio Management Group

Shams Orr-Hruska, CFA, FRM
Director of Quantitative Due Diligence, BlackRock Manager Research
Hedge funds at BlackRock
At BlackRock, we empower our hedge fund investors to operate seamlessly at scale. We harness comprehensive expertise, global reach, and proprietary technology to deliver solutions across geographies, asset classes, and investment styles.
Portable alpha strategies
Explore how portable alpha strategies can potentially increase returns by separating the beta and alpha components of a portfolio.
Hedge Fund Outlook
Geopolitical shifts, deglobalization, and tech advances are reshaping markets. BlackRock’s hedge fund leaders share how they’re navigating this complexity—and where they see the greatest opportunities ahead.