iShares U.S. Equity High Income Active UCITS ETF
- NAV as of 01.10.2026USD 5,8152 WK: 5,15 - 5,94
- 1 Day NAV Change as of 01.10.2026USD 0,02(0,33%)
- NAV Total Return as of 01.10.2026YTD: 13,14
Performance
- Growth of Hypothetical 10,000
- Distributions
- Chart
This chart shows the product’s performance as the percentage loss or gain per year over the last 1 years against its benchmark. It can help you to assess how the product has been managed in the past and compare it to its benchmark.
| 2021 | 2022 | 2023 | 2024 | 2025 | |
|---|---|---|---|---|---|
Total Return (%) USD | 13,9 | ||||
Comparator Benchmark 1 (%) USD | 17,4 |
The figures shown relate to past performance. Past performance is not a reliable indicator of future performance. Markets could develop very differently in the future. It can help you to assess how the fund has been managed in the past
Performance is shown on a Net Asset Value (NAV) basis, with gross income reinvested where applicable. Performance data is based on the net asset value (NAV) of the ETF which may not be the same as the market price of the ETF. Individual shareholders may realize returns that are different to the NAV performance.
The return of your investment may increase or decrease as a result of currency fluctuations if your investment is made in a currency other than that used in the past performance calculation. Source: Blackrock
Key Risks
Key Facts
Net Assets as of 01.10.2026 | USD 60 724 272 |
|---|---|
Share Class launch date | 22.03.2024 |
Share Class Currency | USD |
Asset Class | Equity |
SFDR Classification | Article 8 |
Total Expense Ratio | 0,35% |
Distribution Frequency | Monthly |
Securities Lending Return | - |
UCITS Compliant | Yes |
Fund Manager | BlackRock Asset Management Ireland Limited |
Custodian | State Street Custodial Services (Ireland) Limited |
Bloomberg Ticker | INCU NA |
Net Assets of Fund as of 01.10.2026 | USD 66 798 375 |
|---|---|
Fund Launch Date | 22.03.2024 |
Fund Base Currency | USD |
Comparator Benchmark 1 | S&P 500 Index |
Shares Outstanding as of 01.10.2026 | 10 457 961,00 |
ISIN | IE000WHL2ZK1 |
Use of Income | Distributing |
Domicile | Ireland |
Issuing Company | iShares III plc |
Administrator | State Street Fund Services (Ireland) Limited |
Fiscal Year End | 30 June |
Portfolio Characteristics
Number of Holdings as of 01.10.2026 | 338 |
|---|---|
Standard Deviation (3y) as of - | - |
P/E Ratio as of 01.10.2026 | 30,26 |
12 Month Trailing Dividend Distribution Yield as of 01.10.2026 | 9,12 |
|---|---|
3y Beta as of - | - |
P/B Ratio as of 01.10.2026 | 5,65 |
Registered Locations
Austria
Denmark
Finland
France
Germany
Ireland
Italy
Liechtenstein
Luxembourg
Netherlands
Norway
Saudi Arabia
Spain
Sweden
Switzerland
United Kingdom
Holdings
Exposure Breakdowns
Securities Lending
Securities lending is an established and well regulated activity in the investment management industry. It involves the transfer of securities (such as shares or bonds) from a Lender (in this case, the iShares fund) to a third-party (the Borrower). The Borrower will give the Lender collateral (the Borrower’s pledge) in the form of shares, bonds or cash, and will also pay the Lender a fee. This fee provides additional income for the fund and thus can help to reduce the total cost of ownership of an ETF.
At BlackRock, securities lending is a core investment management function with dedicated trading, research and technology capabilities. The lending programme is designed to deliver superior absolute returns to clients, whilst maintaining a low risk profile. Funds participating in securities lending retain 62.5% of the income, while BlackRock receives 37.5% of the income and covers all the operational costs resulting from securities lending transactions.
The information in the Lending Summary table will not be displayed for the funds that have participated in securities lending for less than 12 months. The figures shown relate to past performance. Past performance is not a reliable indication of current or future results.
BlackRock’s policy is to disclose performance information quarterly subject to a one-month delay. This means that returns from 01/01/2019 to 31/12/2019 can be publicly disclosed from 01/02/2020.
Maximum on-loan figure may increase or decrease over time.
With securities lending there is a risk of loss should the borrower default before the securities are returned, and due to market movements, the value of collateral held has fallen and/or the value of the securities on loan has risen.
Listings
| Euronext Amsterdam | INCU | USD | 26.03.2024 | BRXKJJ7 | INCU NA | INCU.AS |
| London Stock Exchange | INCU | GBP | 27.03.2024 | BPG4W71 | INCU LN | INCU.L |
| Xetra | INCU | EUR | 26.03.2024 | BPG5NF9 | INCU GY | INCU.DE |
1 to 3 of 3
Portfolio Managers

PRIIPs Performance Scenarios
The EU Packaged Retail and Insurance-Based Products Regulation (PRIIPs) prescribes the calculation methodology, and publication of the outcomes, of four hypothetical performance scenarios regarding how the product may perform under certain conditions and for such to be published on a monthly basis. The figures shown include all the costs of the product itself, but may not include all the costs that you pay to your advisor or distributor. The figures do not take into account your personal tax situation, which may also affect how much you get back. What you will get from this product depends on future market performance. Market developments in the future are uncertain and cannot be accurately predicted. The unfavourable, moderate, and favourable scenarios shown are illustrations using the worst, average, and best performance of the product, which may include input from benchmark(s) / proxy, over the last ten years.
- 2025
- 2024
- 2023
- 31 Jul
- 30 Jun
- 31 May
- 30 Apr
- 31 Mar
- 28 Feb
- 31 Jan
| Scenarios | If you exit after 1 year | If you exit after 5 years | |
|---|---|---|---|
Minimum There is no minimum guaranteed return. You could lose some or all of your investment. | |||
Stress What you might get back after costs Average return each year | 7 110 USD -28,9% | 3 750 USD -17,8% | |
Unfavourable What you might get back after costs Average return each year | 8 140 USD -18,6% | 12 030 USD 3,8% | |
Moderate What you might get back after costs Average return each year | 11 500 USD 15,0% | 18 810 USD 13,5% | |
Favourable What you might get back after costs Average return each year | 15 540 USD 55,4% | 23 080 USD 18,2% | |
Sustainability Characteristics
Sustainability Characteristics provide investors with specific non-traditional metrics. Alongside other metrics and information, these enable investors to evaluate funds on certain environmental, social and governance characteristics. Sustainability Characteristics do not provide an indication of current or future performance nor do they represent the potential risk and reward profile of a fund. They are provided for transparency and for information purposes only. Sustainability Characteristics should not be considered solely or in isolation, but instead are one type of information that investors may wish to consider when assessing a fund.
The metrics are not indicative of how or whether ESG factors will be integrated into a fund. Unless otherwise stated in fund documentation and included within a fund’s investment objective, the metrics do not change a fund’s investment objective or constrain the fund’s investable universe, and there is no indication that an ESG or Impact focused investment strategy or exclusionary screens will be adopted by a fund. For more information regarding a fund's investment strategy, please see the fund's prospectus.
Review the MSCI methodologies behind Sustainability Characteristics.
MSCI ESG Fund Rating (AAA-CCC) as of 18.09.2026 | A |
|---|---|
MSCI ESG Quality Score (0-10) as of 18.09.2026 | 6,40 |
Fund Lipper Global Classification as of 18.09.2026 | Equity US |
MSCI Weighted Average Carbon Intensity (Tons CO2E/$M SALES) as of 18.09.2026 | 65,31 |
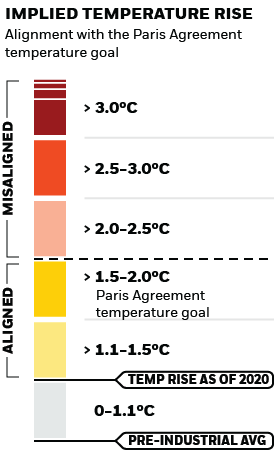
MSCI Implied Temperature Rise (0-3.0+ °C) as of 18.09.2026 | > 3.0° C |
MSCI ESG % Coverage as of 18.09.2026 | 99,30 |
|---|---|
MSCI ESG Quality Score - Peer Percentile as of 18.09.2026 | 27,46 |
Funds in Peer Group as of 18.09.2026 | 3 907 |
MSCI Weighted Average Carbon Intensity % Coverage as of 18.09.2026 | 96,90 |
MSCI Implied Temperature Rise % Coverage as of 18.09.2026 | 96,87 |
What is the Implied Temperature Rise (ITR) metric? Learn what the metric means, how it is calculated, and about the assumptions and limitations for this forward-looking climate-related metric. To address climate change, many of the world's major countries have signed the Paris Agreement. The temperature goal of the Paris Agreement is to limit global warming to well below 2°C above pre-industrial levels, and ideally 1.5 °C, which will help us avoid the most severe impacts of climate change. What is the ITR metric? The ITR metric is used to provide an indication of alignment to the temperature goal of the Paris Agreement for a company or a portfolio. ITR employs open source 1.55° C decarbonization pathways derived from the Network of Central Banks and Supervisors for Greening the Financial System (NGFS). These pathways can be regional and sector specific and set a net zero target of 2050, in line with GFANZ (Glasgow Financial Alliance for Net Zero) industry standards. We make use of this feature for all GHG scopes. This enhanced ITR model was implemented by MSCI on February 19, 2024. How is the ITR metric calculated? The ITR metric is calculated by looking at the current emissions intensity of companies within the fund's portfolio as well as the potential for those companies to reduce its emissions over time. If emissions in the global economy followed the same trend as the emissions of companies within the fund's portfolio, global temperatures would ultimately rise within this band. Note, only corporate issuers are covered within the calculation. A summary explanation of MSCI’s methodology and assumptions for its ITR metric can be found here. Because the ITR metric is calculated in part by considering the potential for a company within the fund’s portfolio to reduce its emissions over time, it is forward-looking and prone to limitations. As a result, BlackRock publishes MSCI’s ITR metric for its funds in temperature range bands. The bands help to underscore the underlying uncertainty in the calculations and the variability of the metric.
What are the key assumptions and limitations of the ITR metric?
This forward-looking metric is calculated based on a model, which is dependent upon multiple assumptions. Also, there are limitations with the data inputs to the model. Importantly, an ITR metric may vary meaningfully across data providers for a variety of reasons due to methodological choices (e.g., differences in time horizons, the scope(s) of emissions included and portfolio aggregation calculations).
There is not a universally accepted way to calculate an ITR. There is not a universally agreed upon set of inputs for the calculation. At present, availability of input data varies across asset classes and markets. To the extent that data becomes more readily available and more accurate over time, we expect that ITR metric methodologies will evolve and may result in different outputs. Funds may change bands as methodologies evolve. Where data is not available, and / or if data changes, the estimation methods vary, particularly those related to a company’s future emissions.
The ITR metric estimates a fund’s alignment with the Paris Agreement temperature goal based on a credibility assessment of stated decarbonization targets. However, there is no guarantee that these estimates will be reached. The ITR metric is not a real time estimate and may change over time, therefore it is prone to variance and may not always reflect a current estimate.
The ITR metric is not an indication or estimate of a fund’s performance or risk. Investors should not rely on this metric when making an investment decision and instead should refer to a fund’s prospectus and governing documents. This estimate and the associated information is not intended as a recommendation to invest in any fund, nor is it intended to indicate any correlation between a fund’s ITR metric and its future investment performance.
To be included in MSCI ESG Fund Ratings, 65% (or 50% for bond funds and money market funds) of the fund’s gross weight must come from securities with ESG coverage by MSCI ESG Research (certain cash positions and other asset types deemed not relevant for ESG analysis by MSCI are removed prior to calculating a fund’s gross weight; the absolute values of short positions are included but treated as uncovered), the fund’s holdings date must be less than one year old, and the fund must have at least ten securities.
Business Involvement
Business Involvement metrics can help investors gain a more comprehensive view of specific activities in which a fund may be exposed through its investments.
Business Involvement metrics are not indicative of a fund’s investment objective, and, unless otherwise stated in fund documentation and included within a fund’s investment objective, do not change a fund’s investment objective or constrain the fund’s investable universe, and there is no indication that an ESG or Impact focused investment strategy or exclusionary screens will be adopted by a fund. For more information regarding a fund's investment strategy, please see the fund's prospectus.
Review the MSCI methodology behind the Business Involvement metrics, using links below.
MSCI - Controversial Weapons as of 01.10.2026 | 0,00% |
|---|---|
MSCI - Nuclear Weapons as of 01.10.2026 | 0,00% |
MSCI - Civilian Firearms as of 01.10.2026 | 0,00% |
MSCI - Tobacco as of 01.10.2026 | 0,00% |
MSCI - UN Global Compact Violators as of 01.10.2026 | 0,00% |
|---|---|
MSCI - Thermal Coal as of 01.10.2026 | 0,00% |
MSCI - Oil Sands as of 01.10.2026 | 0,00% |
Business Involvement Coverage as of 01.10.2026 | 98,06% |
|---|
Percentage of Fund not covered as of 01.10.2026 | 1,94% |
|---|
BlackRock business involvement exposures as shown above for Thermal Coal and Oil Sands are calculated and reported for companies that generate more than 5% of revenue from thermal coal or oil sands as defined by MSCI ESG Research. For the exposure to companies that generate any revenue from thermal coal or oil sands (at a 0% revenue threshold), as defined by MSCI ESG Research, it is as follows: Thermal Coal 0,00% and for Oil Sands 2,55%.
Business Involvement metrics are calculated by BlackRock using data from MSCI ESG Research which provides a profile of each company’s specific business involvement. BlackRock leverages this data to provide a summed up view across holdings and translates it to a fund's market value exposure to the listed Business Involvement areas above.
Business Involvement metrics are designed only to identify companies where MSCI has conducted research and identified as having involvement in the covered activity. As a result, it is possible there is additional involvement in these covered activities where MSCI does not have coverage. This information should not be used to produce comprehensive lists of companies without involvement. Business Involvement metrics are only displayed if at least 1% of the fund’s gross weight includes securities covered by MSCI ESG Research.
ESG Integration
BlackRock considers many investment risks in our processes. In order to seek the best risk-adjusted returns for our clients, we manage material risks and opportunities that could impact portfolios, including financially material Environmental, Social and/or Governance (ESG) data or information, where available. See our Firm Wide ESG Integration Statement for more information on this approach and fund documentation for how these material risks are considered within this product, where applicable.
Literature
- iShares III plc - Prospectus (English)PDF, opens in a new tab
- iShares U.S. Equity High Income Active UCITS ETF USD (Dist) - PRIIPPDF, opens in a new tab
- iShares U.S. Equity High Income Active UCITS ETF U.S. Dollar FactsheetPDF, opens in a new tab
- Sustainability related disclosure - ISINCUCPAG (en)PDF, opens in a new tab
- Sustainability related disclosure - ISINCUCPAG (fi)PDF, opens in a new tab
- iShares III plc - Annual Report (English)PDF, opens in a new tab
- iShares III plc - Annual Report (English)PDF, opens in a new tab
- iShares III plc - Annual Report (English)PDF, opens in a new tab
If the Fund invests in any underlying fund, certain portfolio information, including sustainability characteristics and business-involvement metrics, provided for the Fund may include information (on a look-through basis) of such underlying fund, to the extent available.
BlackRock Portfolio Managers have access to research, data, tools, and analytics to integrate ESG insights into their investment process. Aladdin is the operating system that connects the data, people and technology necessary to manage portfolios in real time, as well as the engine behind BlackRock’s ESG analytics and reporting capabilities. BlackRock’s Portfolio Managers use Aladdin to make investment decisions, monitor portfolios and to access material ESG insights that can inform the investment process to attain ESG characteristics of the fund. ESG datasets are sourced from external third-party data providers, including but not limited to MSCI and Sustainalytics. These datasets include headline ESG scores, carbon data, business involvement metrics or controversies and have been incorporated into Aladdin tools that are available to Portfolio Managers. Such tools support the full investment process, from research, to portfolio construction and modeling, to reporting. In addition to having access to these datasets in Aladdin, where applicable, Portfolio Managers could also supplement these sources with sell side research, non-government organization reports, company reported data, fundamental research insights prepared by BlackRock equity and credit investment research teams. In order to offer scalable solutions to investors across different asset classes and investment styles, BlackRock has developed a set of exclusionary screens, “BlackRock EMEA Baseline Screens”, that seeks to address a majority of our clients’ requests for exclusions. As an example, these exclusionary screens eliminate holdings with more than de minimis exposure to certain sectors/industries including but not limited to controversial weapons, nuclear weapons, fossil fuels, civilian firearms, tobacco, and UN Global Compact violators. BlackRock EMEA Baseline Screens are applied on all new active funds in Europe, Middle East and Africa (“EMEA”), on a comply or explain basis by our portfolio management teams within our product governance structure. For all new sustainable index strategies in EMEA, BlackRock works with the index provider to reflect the same screens in the custom index. Qualified investors with separate accounts can have exclusionary screens set with specific criteria as determined by the investor. The definition of the baseline screens and its adoption into sustainable screened funds is governed by the Sustainable Product Council (“SPC”). The current default ESG data provider for these Baseline Screens is MSCI but investment teams can choose to use Sustainalytics or other custom data sources as required. For further SFDR related fund/sub-fund level disclosures, please refer to the fund/ sub-fund specific Investment Objective and Policy section(s) and benchmark information in the prospectus that is available on the website.
For funds with an investment objective that include the integration of ESG criteria, there may be corporate actions or other situations that may cause the fund or index to passively hold securities that may not comply with ESG criteria. Please refer to the fund’s prospectus for more information. The screening applied by the fund's index provider may include revenue thresholds set by the index provider. The information displayed on this website may not include all of the screens that apply to the relevant index or the relevant fund. These screens are described in more detail in the fund’s prospectus, other fund documents, and the relevant index methodology document. Review the MSCI methodology behind the Sustainability Characteristics and Business Involvement metrics: 1ESG Fund Ratings; 2Index Carbon Footprint Metrics; 3Business Involvement Screening Research; 4ESG Screened Index Methodology; 5ESG Controversies; 6MSCI Implied Temperature Rise Certain information contained herein (the “Information”) has been provided by MSCI ESG Research LLC, a RIA under the Investment Advisers Act of 1940, and may include data from its affiliates (including MSCI Inc. and its subsidiaries (“MSCI”)), or third party suppliers (each an “Information Provider”), and it may not be reproduced or redisseminated in whole or in part without prior written permission. The Information has not been submitted to, nor received approval from, the US SEC or any other regulatory body. The Information may not be used to create any derivative works, or in connection with, nor does it constitute, an offer to buy or sell, or a promotion or recommendation of, any security, financial instrument or product or trading strategy, nor should it be taken as an indication or guarantee of any future performance, analysis, forecast or prediction. Some funds may be based on or linked to MSCI indexes, and MSCI may be compensated based on the fund’s assets under management or other measures. MSCI has established an information barrier between equity index research and certain Information. None of the Information in and of itself can be used to determine which securities to buy or sell or when to buy or sell them. The Information is provided “as is” and the user of the Information assumes the entire risk of any use it may make or permit to be made of the Information. Neither MSCI ESG Research nor any Information Party makes any representations or express or implied warranties (which are expressly disclaimed), nor shall they incur liability for any errors or omissions in the Information, or for any damages related thereto. The foregoing shall not exclude or limit any liability that may not by applicable law be excluded or limited.