Jean Boivin
Head — BlackRock Investment Institute
Looking long-term
Our longer-term conviction on the AI transformation underpins our strategic overweight in U.S. equities, even as near-term risks warrant tactical caution.
Market Backdrop
The S&P 500 recovered most of its post-election losses, helped by AI stocks. The rally suggests AI earnings optimism still outweighs higher rates, for now.
Week Ahead
We eye fresh inflation data in Japan and across the euro zone for clues on how higher energy costs are impacting price pressures.
Recent swings in tech stocks reflect growing uncertainty over how the AI buildout will evolve and what that means for earnings. We downgraded U.S. stocks tactically last month, but our longer-term conviction rests on AI’s improving capabilities and adoption over time – not on today’s earnings growth or winners staying on top.
Our latest capital market assumptions (for professional investors only) reinforce our strategic overweight in U.S. equities over a horizon of five years or longer.
S&P 500 cyclically adjusted and 12-month forward P/E ratios, 2000–26
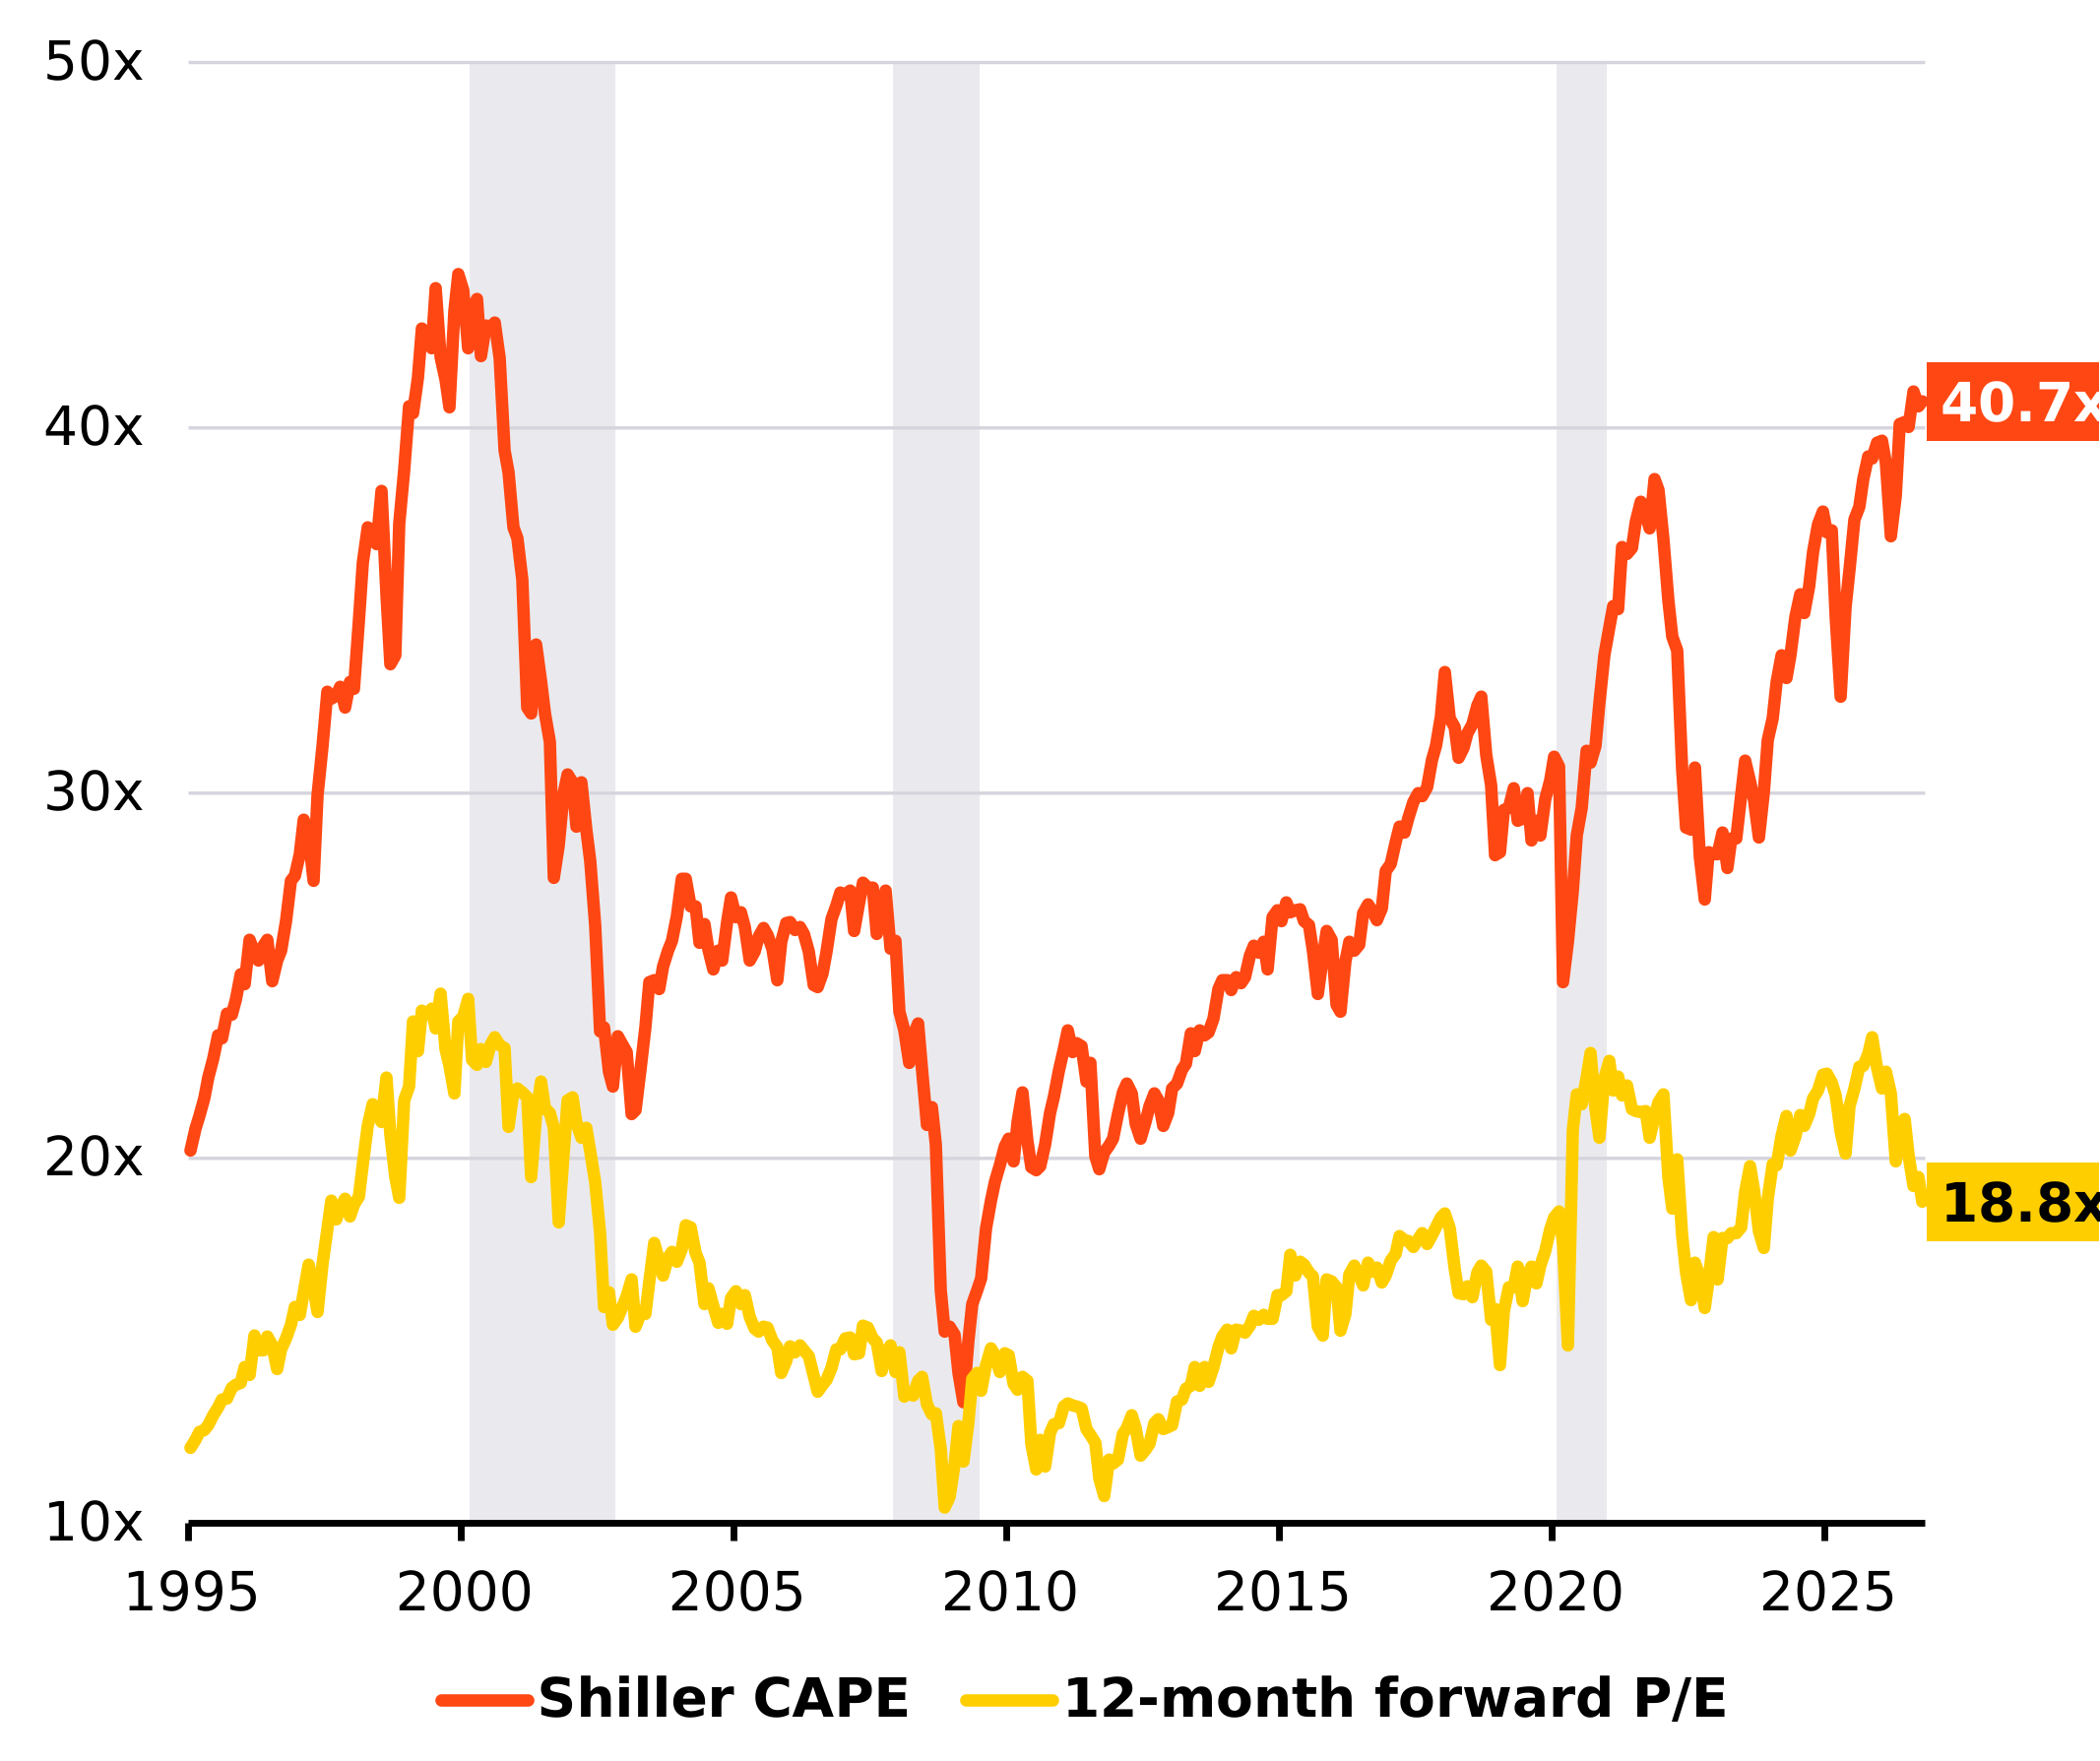
Past performance is not a reliable indicator of current or future results. Source: BlackRock Investment Institute, LSEG Datastream, November 2026. Notes: CAPE uses 10-year inflation-adjusted earnings; forward P/E uses 12-month earnings estimates. Shading marks the dot-com bust (2000–02), global financial crisis (2007–09) and COVID-19 (2020).
The valuation picture for U.S. equities depends on the measure used. The Shiller cyclically adjusted price-to-earnings ratio (CAPE) suggests valuations are near dot-com bubble highs. See the chart. The S&P 500’s 12-month forward P/E looks less stretched by historical standards, but only because investors expect strong earnings growth. Whether those expectations are justified is an open question. The key uncertainty is how the AI buildout evolves relative to demand and adoption. Falling computing costs could squeeze suppliers’ profits, while bottlenecks could delay AI adoption. Both could cause near-term pressure, but neither necessarily undermines the longer-term opportunity, in our view.
Ample uncertainty still hangs over the longer-term picture. That’s a key feature of the polyfurcated environment we’ve long described, where multiple scenarios are plausible. Overcapacity is a risk, and builders' earnings could slow before adopters see meaningful gains. Our strategic conviction doesn't assume that current winners will remain winners. Instead, our starting-point scenario explicitly sees valuations declining without assuming a permanent growth breakout. Yet AI’s improving capabilities could drive broader adoption, boosting productivity, profit margins and earnings over time. We see particular opportunities in U.S. health care, IT, tech, and financials, where stronger longer-term earnings prospects help underpin our strategic overweight in U.S. equities, a key driver of our broader developed-market equity overweight.
The longer-term AI opportunity, however, requires substantial investment to make it a reality. Companies financing the AI buildout are competing with governments borrowing heavily from the same pool of savings, intensifying competition for capital. That backdrop has led us to revise up our interest rate expectations in our CMAs. We expect central bank policy rates to stay elevated for longer, reflecting a higher expected neutral interest rate. Yet stronger growth and earnings can coexist with higher borrowing costs, and a higher-rate environment is increasingly reflected in market prices.
That repricing has improved bonds’ strategic appeal, with higher starting yields offering better compensation for longer-term interest rate risk. For the first time since 2020, we are taking a more constructive view on duration risk. We have moved to neutral on developed-market government bonds and strengthened our overweight in inflation-linked bonds, which offer attractive yields and protection against inflation risks tied to supply constraints. Yet government bonds are no longer the all-weather diversifiers they once were. Persistent inflation pressures limit central banks’ ability to cut rates and drive bond yields lower, reducing the scope for bond prices to rise. That’s also why we favor building portfolios granularly around specific exposures and convictions rather than asset class labels, reflecting a broader industry shift toward a total portfolio approach.
We maintain our strategic overweight in U.S. equities, backed by our conviction in AI’s longer-term earnings potential. Higher yields also strengthen the case for bonds, particularly inflation-linked bonds.
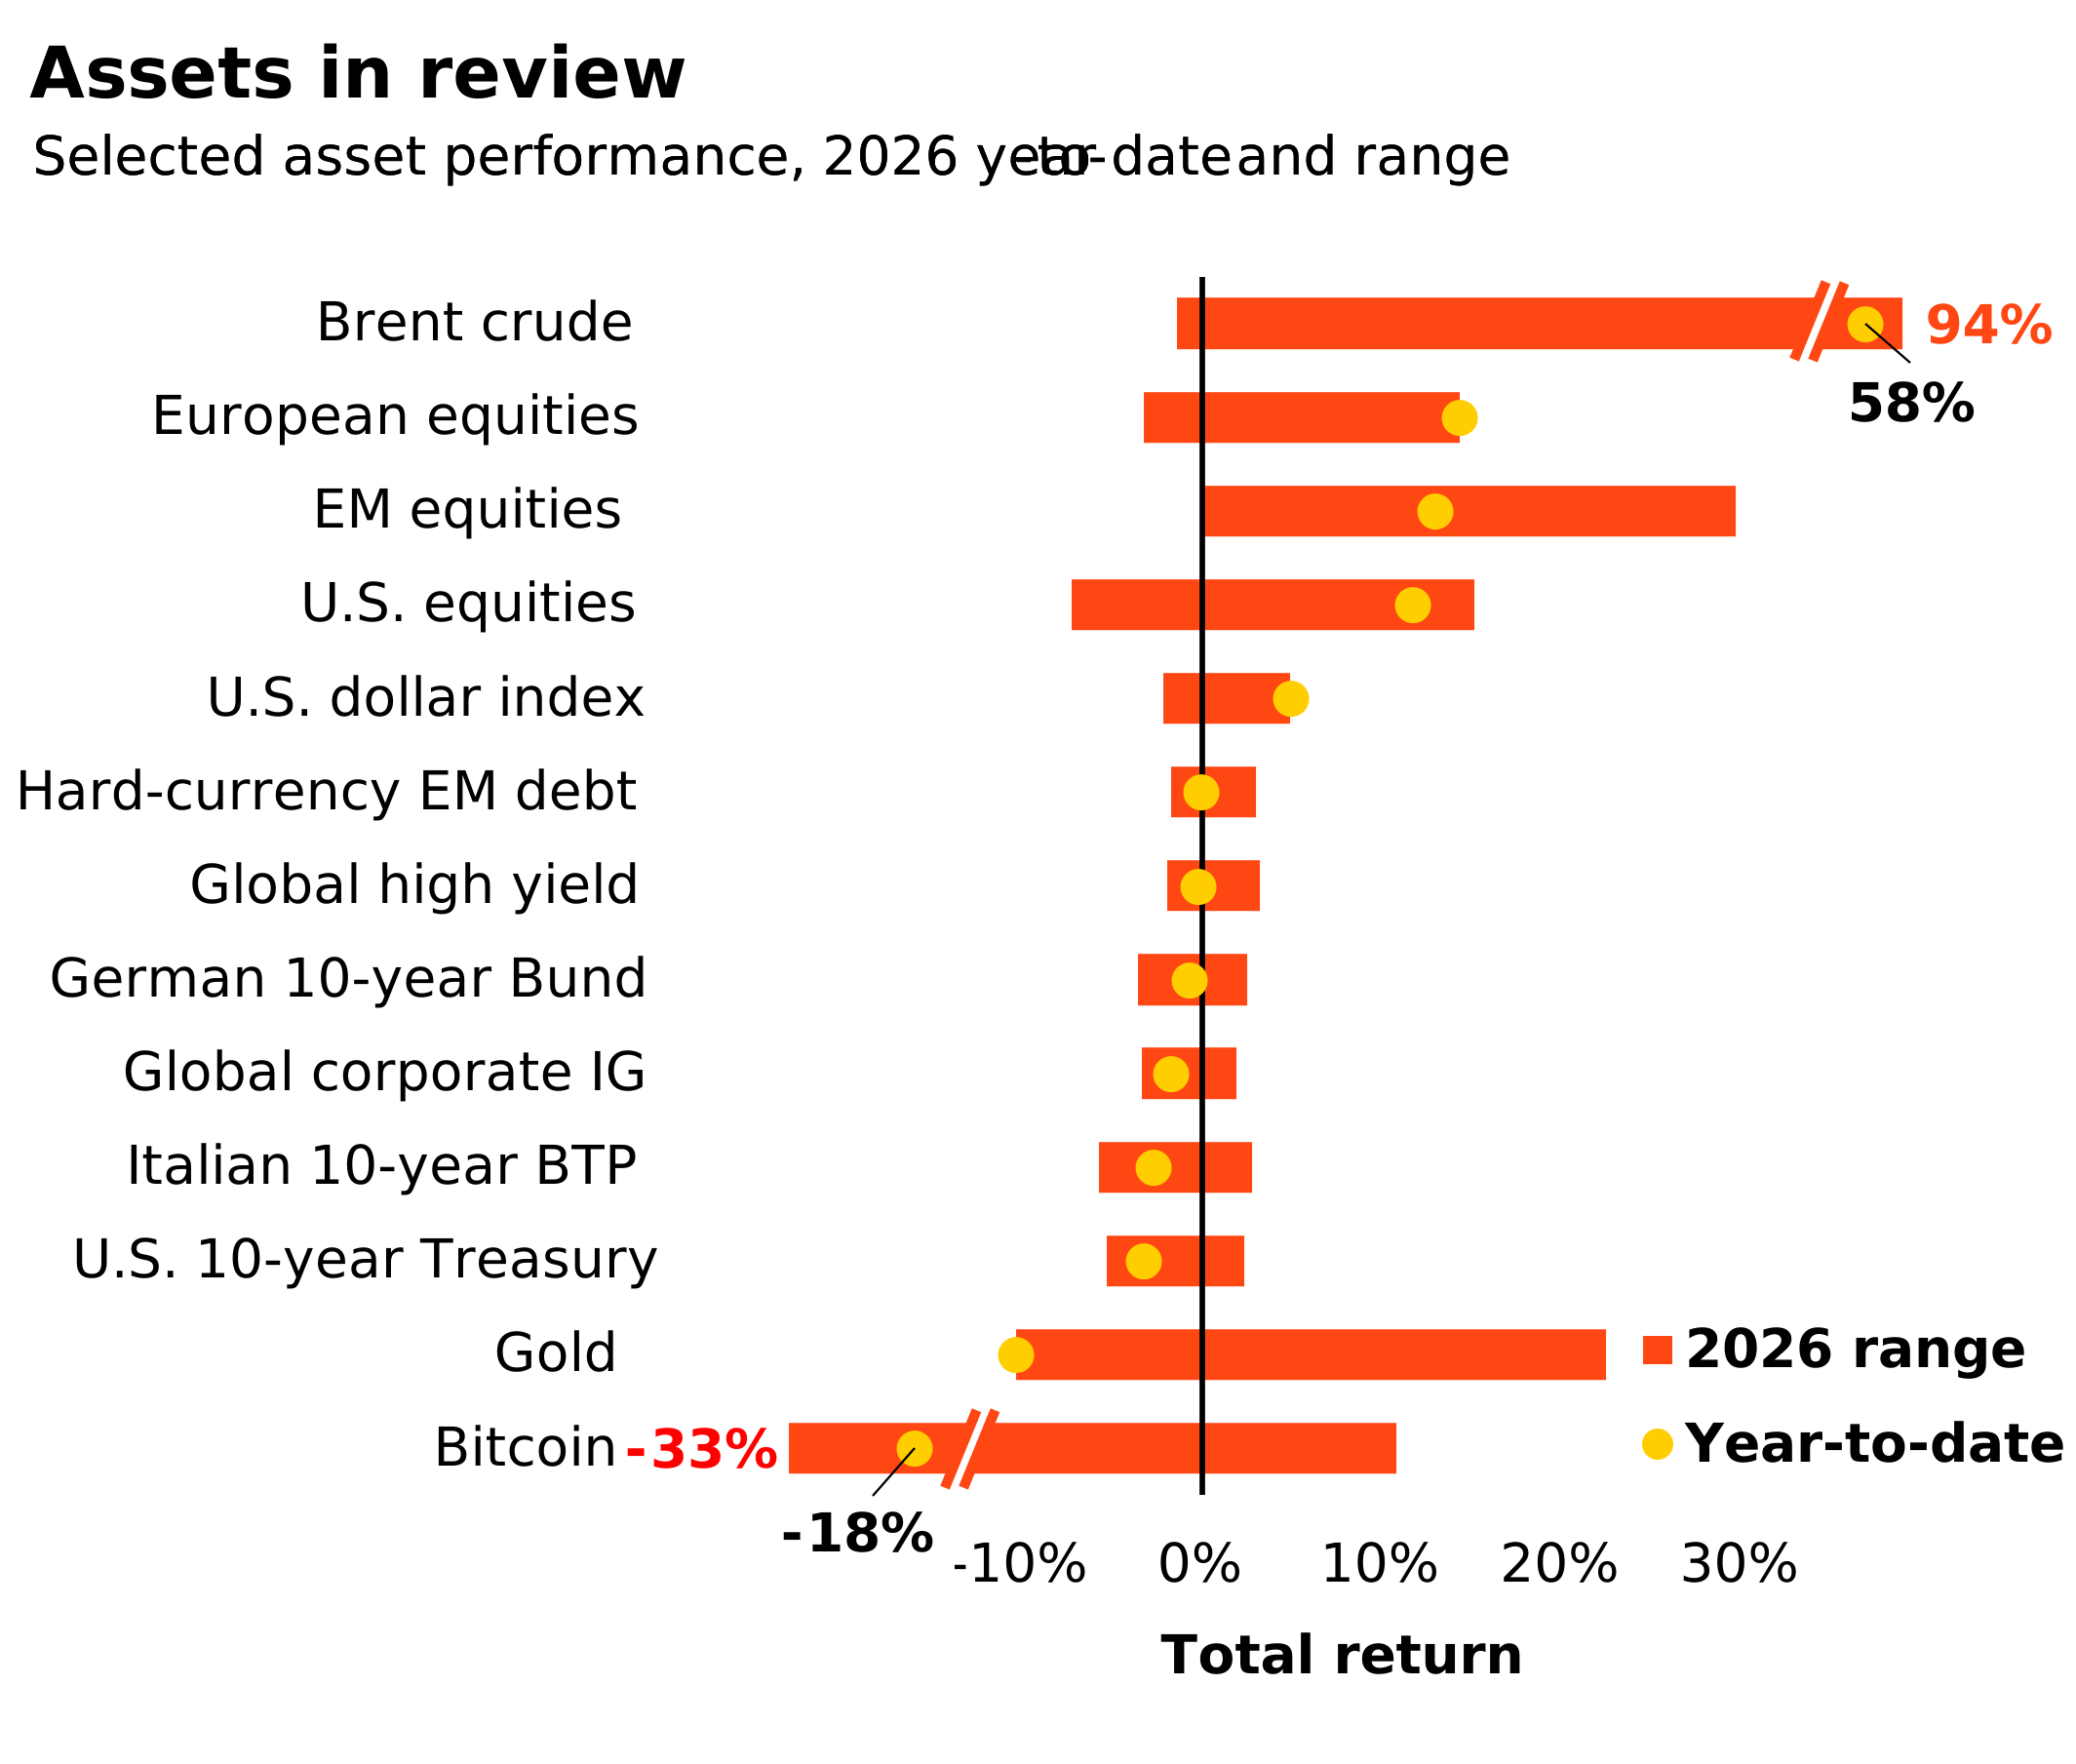
U.S. stocks recovered nearly all their post-midterm election losses last week as an AI-led rebound gave the S&P 500 its best week since early August. Chip stocks led the gains, with the Philadelphia Semiconductor index surging 8%. The rebound suggests AI earnings optimism is outweighing pressure from higher interest rates, for now. Two-year U.S. Treasury yields jumped 33 basis points to 4.86% after hawkish comments from Fed officials and a hotter-than-expected inflation report.
We’re watching European and Japanese inflation data for signs that higher energy costs are fueling broader price pressures, potentially prompting further interest rate hikes. European consumer confidence will also offer clues on how households are coping with higher costs and what that means for the region’s economic outlook.
Nov. 17
UK unemployment
Nov. 18
UK CPI; Japan trade balance
Nov. 19
Philadelphia Fed business index
Nov. 20
EU flash consumer confidence; Japan CPI
Read our past weekly market commentaries here
Since we launched our mega forces framework, it has become clearer how their intersection shapes almost all our investment views and opens up alpha opportunities. They cut across asset class labels, spurring a rethink of portfolio construction. Investors need to be deliberate about the economic or thematic exposures they own, the vehicles they use to implement them and their investment horizons.
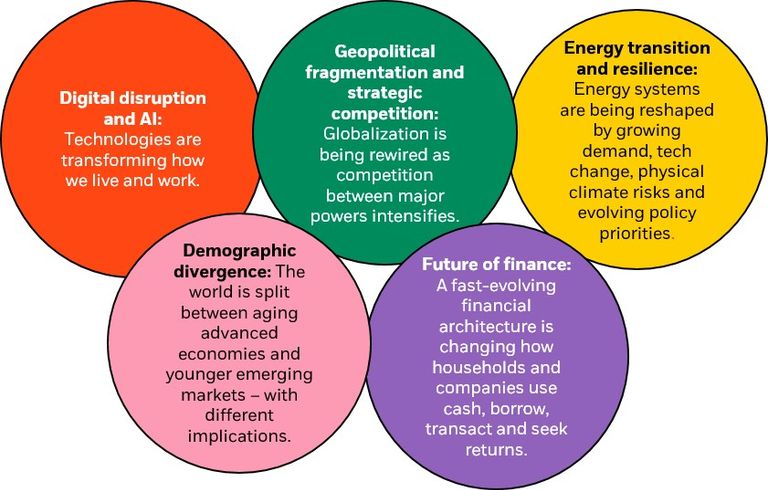
Our highest conviction views, November 2026
Note: Views are from a U.S. dollar perspective, November 2026. This material represents an assessment of the market environment at a specific time and is not intended to be a forecast of future events or a guarantee of future results. This information should not be relied upon by the reader as research or investment advice regarding any particular funds, strategy or security.
Six- to 12-month tactical positioning, November 2026
This shows the implementation of our key investment views from the previous page through an asset class lens.

Past performance is not a reliable indicator of current or future results. It is not possible to invest directly in an index. Note: Views are from a U.S. dollar perspective. This material represents an assessment of the market environment at a specific time and is not intended to be a forecast or guarantee of future results. This information should not be relied upon as investment advice regarding any particular fund, strategy or security.
Six to 12-month tactical views on selected assets vs. broad global asset classes by level of conviction, November 2026
We have lengthened our tactical investment horizon back to six to 12 months. The table below reflects this and, importantly, leaves aside the opportunity for alpha, or the potential to generate above-benchmark returns – especially at a time of heightened volatility.
Past performance is not a reliable indicator of current or future results. It is not possible to invest directly in an index. Note: Views are from a euro perspective, November 2026. This material represents an assessment of the market environment at a specific time and is not intended to be a forecast or guarantee of future results. This information should not be relied upon as investment advice regarding any particular fund, strategy or security.

Stay informed on our latest weekly Market take. Listen wherever you get your podcasts.